
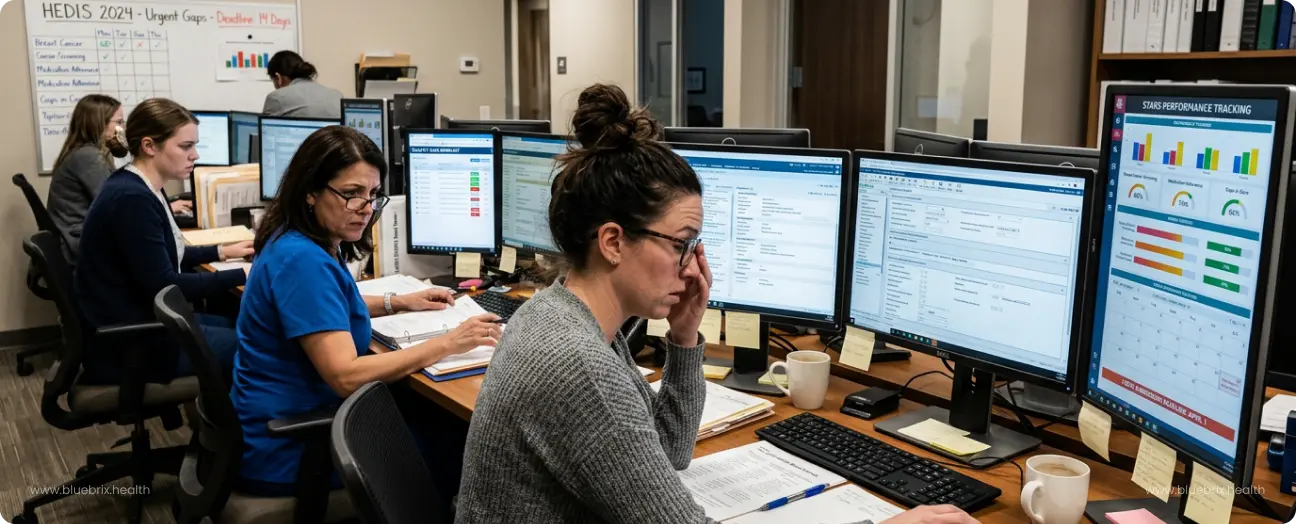
Picture what happens every year at most Medicare Advantage plans and health systems in the months leading up to HEDIS submission. The quality department shifts into crisis mode. Care management work pauses. Staff get pulled into chart review. Everyone starts working longer hours.
And for what? To manually extract data from records that already exist in electronic systems. Whether a diabetic patient had an A1c test. Whether a blood pressure reading was documented correctly. Data that is already in the EHR but still requires manual review to access. This is not an edge case. It is the operational reality for many health plans and health systems. And the cost is higher than most leadership teams realize.
The people who feel it most are the quality directors and clinical specialists running this process every day. They are spending skilled professionals on work that adds little clinical value, often discovering care gaps only after the chance to act has passed.
Manual HEDIS abstraction is not just an operational problem. It is a morale problem, a retention problem, and increasingly a competitive disadvantage. This is the kind of operational challenge blueBriX was built to solve through real-time quality management.
The organizations improving their Star Ratings are not working harder. They changed the model. Instead of trying to do manual abstraction better, they made it largely unnecessary. This article is about that shift.
Why manual HEDIS abstraction doesn't scale for modern health plans?
To understand why the manual abstraction model is breaking down, it helps to look at what it actually involves. Much of this work happens deep inside quality operations, so its complexity is often underestimated by leadership.
What does HEDIS abstraction actually involve?
HEDIS measurement relies on two primary data types. Administrative measures use claims, encounter, and eligibility data and can be calculated programmatically. Hybrid measures, which include many of the most consequential quality indicators, combine administrative data with manually reviewed medical records to confirm that care was delivered and documented.
After the measurement year closes, the plan identifies members who may need record review and generates a chase list. Medical records are retrieved from providers and reviewed by trained abstractors looking for documentation that meets measure criteria. The findings are compiled, submitted to the organization’s HEDIS reporting engine, and later reviewed by auditors as part of the compliance process.
This entire cycle typically runs from January through June, placing sustained pressure on quality teams during the months leading up to submission.
Why hybrid measures require manual chart review?
When hybrid measures were originally designed, electronic clinical data was limited, and manual chart review was a practical way to verify care delivery. Today, the landscape is very different. EHR adoption is widespread, and structured clinical data is far more available. Many measures are already transitioning toward electronic reporting models.
Yet many organizations continue to rely on processes built for a pre-EHR environment. Manual chart review persists not because data is missing, but because systems are not fully connected. Clinical documentation and quality measurement often exist in separate workflows, making the data difficult to access without human intervention.
The abstraction challenge is not a data problem. The data already exists. It is an infrastructure problem.
Meanwhile, the measurement environment continues to grow more complex. Plans are evaluated across dozens of quality measures, and technical specifications change regularly. Each update requires retraining, workflow adjustments, and ongoing oversight. For organizations with frequent staff turnover, this creates a continuous cycle of retraining that limits scalability and strains operational stability.
The true cost of manual HEDIS abstraction: staff, errors, and missed revenue
Most organizations know that manual abstraction is expensive. What they often do not know is the full scope of what it is costing them, because many of the costs are either hidden, misattributed, or simply accepted as the normal cost of doing business in healthcare quality measurement. Let’s break them down.
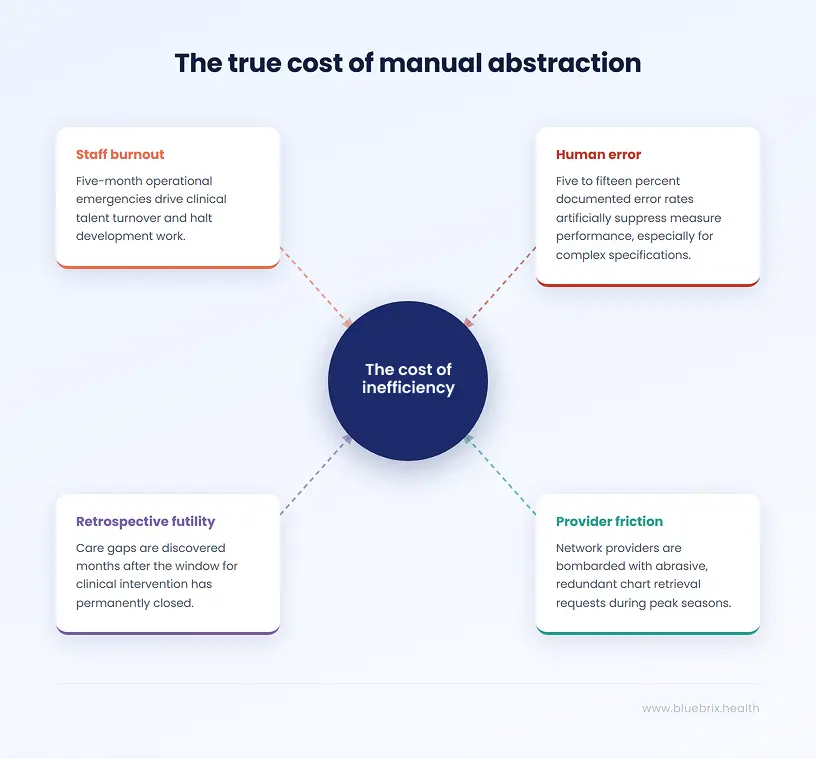
- Staff burnout with no structural off-ramp: Manual abstraction turns the months leading up to submission into a sustained operational emergency. Quality teams shift into crisis mode, pausing improvement work and redirecting skilled clinicians into repetitive chart review. Even after submission, teams move immediately into preparation for the next cycle, leaving little time to recover and contributing to ongoing burnout and turnover.
- Human error and missed numerators: Manual review introduces measurable error risk, especially when specifications change or deadlines tighten. Even small inaccuracies can translate into lower performance scores and lost revenue, particularly for organizations operating near critical Star Rating thresholds.
- Retrospective discovery that arrives too late: Manual abstraction identifies care gaps after the measurement year has already closed. At that point, the organization can document the gap but cannot correct it. The process measures past performance instead of enabling timely intervention.
- Provider relationship friction: Record requests and follow-ups create administrative burden for provider offices, particularly during peak reporting periods. Delays, incomplete records, and repeated outreach can strain collaboration at the exact moment when strong plan-provider coordination is most important.
- Structural inability to scale for year-round gap closure: The abstraction model is designed around an annual reporting cycle rather than continuous performance management. It concentrates effort into a short window instead of supporting proactive gap closure throughout the year. Organizations consistently achieving higher Star Ratings have moved toward real-time, continuous quality management rather than seasonal reporting workflows.
How Medicare Advantage Star Ratings translate directly into bonus revenue?
The financial consequences of Star Rating performance are large enough that they deserve explicit, concrete treatment. For many organizations, the true financial exposure from suboptimal abstraction is not on the abstraction budget line. It is in the bonus revenue that never materializes because the Star Rating fell short of the threshold that would have earned it.
The quality bonus program: $13 billion at stake in 2025
CMS quality bonus payments to Medicare Advantage plans totaled at least $13 billion in 2025, more than four times the $3 billion paid in 2015. Plans earning an average annual bonus of $372 per enrollee in 2025. For a plan with 100,000 members in bonus status, that is $37.2 million in bonus revenue above baseline. For a plan with 500,000 members, it is $186 million.
Plans rated four stars or above qualify for quality bonus payments and a higher rebate percentage, which they can use to offer enhanced benefits, lower cost sharing, or additional services. Plans below four stars receive no quality bonus. There is no partial credit. The threshold creates a binary revenue event at the four-star line.
A single half-star decline from 4.0 to 3.5 does not reduce bonus revenue. It eliminates it entirely. For large Medicare Advantage plans, this is a revenue cliff measured in tens or hundreds of millions of dollars annually.
Why falling below 4 stars is a revenue cliff?
Only 40 percent of Medicare Advantage prescription drug plans achieved four stars or higher in 2025, down from 68 percent in 2022. The third consecutive year of decline. CMS has been increasing measure-level cut points, meaning that plans now need to achieve higher absolute performance on individual measures to receive the same star rating they received in prior years.
Research has consistently shown that a one-star improvement in CMS rating is associated with an 8 to 10 percent increase in Medicare Advantage enrollment. The compounding effect of losing bonus revenue and losing enrollment simultaneously is significant enough to threaten the financial stability of plans that allow their ratings to slip. Humana’s stock price took a significant hit following a 0.74 average star rating decrease, underscoring just how seriously capital markets treat Stars performance.
How a half-star drop affects enrollment?
Industry estimates place the cost of manual abstraction at between $15 and $50 per record reviewed depending on complexity, experience, and whether the organization uses internal staff or external vendors. For a mid-sized Medicare Advantage plan reviewing 10,000 records annually, that is between $150,000 and $500,000 per year in direct abstraction costs before accounting for fully-loaded staff time, benefits, and overhead. For larger organizations, these numbers scale significantly.
But the direct abstraction cost is the smaller number in this equation. The larger number is the revenue impact of a Star Rating that is lower than it should be because of preventable documentation gaps, abstraction errors, and the structural inability of a manual process to capture quality data accurately and completely. For organizations operating near the four-star threshold, closing even a fraction of those preventable gaps can be the difference between bonus eligibility and revenue loss.
The HEDIS documentation gap: how delivered care gets lost before submission
There is a particular kind of frustration that quality directors describe when they talk about HEDIS abstraction season. It is not just the volume of work or the pressure of the deadline. It is the discovery, repeated every single year, that care was actually delivered; the patient had the test, the provider ordered the screening, the blood pressure was documented; but because of how or when the information was recorded, it does not count.
The care happened. The patient benefited. The provider did their job. But for HEDIS and Stars purposes, it might as well not have occurred. This is the documentation trap, and it is responsible for a larger share of quality performance losses than most organizations recognize.
The structural lag that makes it worse
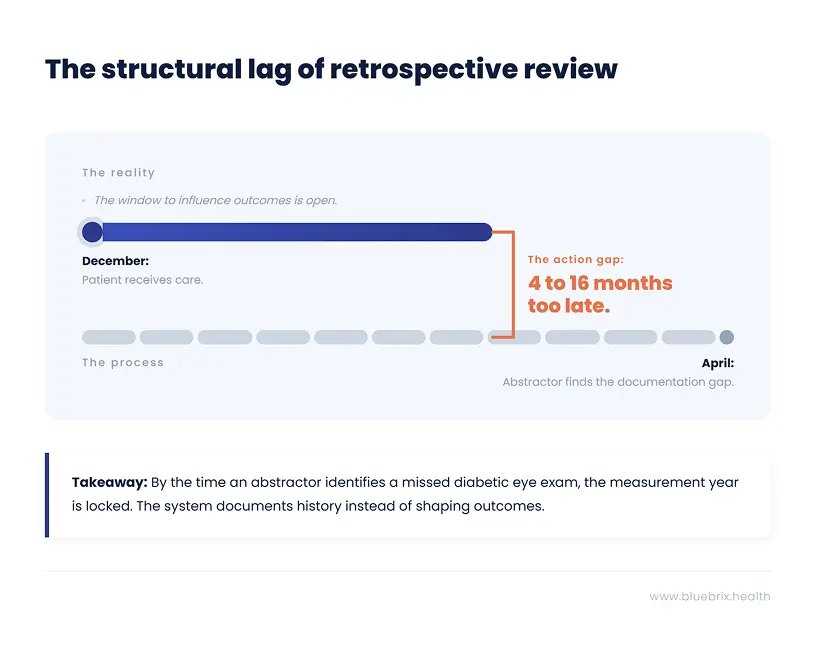
The HEDIS measurement year runs from January 1 through December 31. But the abstraction review that determines what counts does not happen until the following spring, typically April through May for hybrid measures. That is a gap of four to sixteen months between when care is delivered and when anyone looks to see whether it was documented in a way that satisfies the measure criteria.
During that entire window, the documentation is fixed. The encounter notes are written. The structured fields are populated or they are not. The lab result is in the EHR or it is in a PDF scanned from a specialist’s office that nobody has mapped to the relevant measure. By the time an abstractor finds the gap, the options are to document the miss and move on. There is no mechanism to go back and close it.
NCQA audits consistently identify data fragmentation as a top contributor to failed measures. This is not a documentation quality problem in the sense that providers are doing bad clinical work. It is a data infrastructure problem. The care is being delivered in one system. The quality measurement is happening in another. And the two systems are not talking to each other in real time.
Five ways delivered care disappears from your HEDIS record
Understanding the specific failure modes makes it possible to address them systematically:
- Specialist data that never reaches the plan: A patient sees a cardiologist for a follow-up visit that satisfies a HEDIS measure. The cardiologist documents the visit in their own EHR. That documentation never reaches the health plan’s quality system because there is no structured data feed between the two. The measure is counted as unmet even though the care was delivered.
- Unstructured documentation that cannot be queried: A provider documents a blood pressure reading in a narrative note rather than a structured field. The value exists in the EHR but is not queryable by any automated system. An abstractor can find it if they read the note, but an automated quality engine cannot.
- Timing gaps between service and claim: A service is delivered in December but the claim is not processed until January of the following year. By the time the claim is available in administrative data, the measurement year has closed and the service cannot count toward the current year’s measures.
- Coding specificity mismatches: A provider documents a chronic condition using a code that is clinically accurate but not at the specificity level required by the HEDIS measure specification. The condition is present. The care was delivered. But the code used does not match the value set, and the measure is counted as unmet.
- Supplemental data submitted too late: Some organizations use supplemental data submission processes to add clinical information to their quality reporting after the administrative data deadline. These processes are time-consuming and require coordination with providers. Organizations without robust supplemental data workflows miss significant opportunities to claim credit for care that was actually delivered.
Most HEDIS performance losses are not losses of care. They are losses of documentation. The patient received the service. The system failed to record it in a way that quality measurement can see.
The implications of this are significant. Organizations that focus exclusively on improving care delivery to move quality metrics are solving the wrong problem if the underlying issue is documentation capture. And organizations that focus exclusively on improving abstraction efficiency are still working around a broken data infrastructure rather than fixing it.
The fix is not better abstractors. It is better data architecture. Capturing quality-relevant clinical information in structured, queryable formats at the point of documentation, so that the measure determination happens as a natural byproduct of care delivery rather than as a retrospective extraction exercise months later.
Year-round HEDIS performance management vs. the annual abstraction sprint
Here is a question worth sitting with: if your Star Rating is determined by what happened to your members during the calendar year just ended, why are you spending the first half of the following year trying to figure out what happened?
The answer, for most organizations, is that their quality measurement infrastructure is not built to answer the question in real time. They learn about their performance retrospectively because they have no mechanism to track it prospectively. And by the time they know what happened, the measurement year is locked. The gaps they discovered in March were created in April through December of the prior year, during the months when there was still time to do something about them.
This is the fundamental strategic failure of the manual abstraction model. It turns a performance management function into a historical documentation function. And it creates a structural incentive to optimize the measurement process rather than the underlying performance.
Why the best-performing plans think about HEDIS in January, not April?
The organizations consistently separating from the pack on Star Ratings share a common characteristic: they treat quality measurement as a continuous operational function, not an annual reporting exercise. Their quality teams have live visibility into measure performance throughout the year. They know in January whether they are on track for their Stars target. They know in March which providers are lagging on specific measures. They can direct gap closure resources to exactly where they are needed, precisely when there is still time to make a difference.
In practical terms, this means several things happening simultaneously that manual abstraction makes impossible:
- Monthly data refreshes that show current measure performance against targets, by provider, by care site, and by patient demographic, so that the quality team always has an accurate picture of where they stand.
- Automated identification of patients with open care gaps who are scheduled for upcoming appointments, so that providers can address the gap during the visit rather than discovering it retrospectively.
- Real-time alerts when a patient with an open HEDIS measure has a care encounter documented anywhere in the network, triggering outreach to confirm whether the measure was addressed.
- Proactive outreach to members with open gaps early in the measurement year, when there is time to schedule the needed service, rather than in the final weeks before the deadline when scheduling is impossible.
- Provider-level performance dashboards updated continuously, giving network management teams the data they need for quality improvement conversations with practices, rather than annual summaries that are already outdated by the time they are shared.
The compounding advantage of early care gap closure
Research on HEDIS performance improvement consistently shows that the timing of gap closure efforts is as important as the volume. A gap closed in March of the measurement year counts the same as a gap closed in November, but the cost of closing it in March is far lower. Members are easier to reach when the intervention is proactive rather than urgent. Providers are more receptive to quality improvement conversations when they are not in the middle of a high-pressure compliance push. And the quality team is not competing with a dozen other gap closure priorities simultaneously.
Organizations that run year-round quality programs consistently close more gaps at lower cost than organizations that concentrate all their effort into the final months of the measurement year. The flywheel effect compounds over time: better data leads to better targeting, better targeting leads to higher closure rates, higher closure rates lead to better Star Ratings, better Star Ratings lead to more enrollment, more enrollment provides more resources for quality investment.
The organizations winning on Stars are not working harder. They are working in a different temporal frame. They are closing gaps in January that their competitors will not discover until May of the following year.
What monthly HEDIS data refreshes actually change?
Industry data suggests that roughly half of health plans that report HEDIS scores do not perform monthly data refreshes. They are operating with quality data that is months old, making decisions about where to direct resources based on information that no longer reflects current performance. This is not because quality directors do not understand the value of real-time data. It is because their existing infrastructure cannot produce it. Monthly refreshes are not possible when quality measurement depends on a manual abstraction cycle that happens once a year.
The barrier to the year-round model is not strategic understanding. It is infrastructure. And that is the barrier this article is ultimately about.
How to automate HEDIS abstraction: the four pillars of modern quality infrastructure
Before naming any specific platform, it is worth being precise about what a genuine solution to the manual abstraction problem actually needs to deliver. The market includes a range of tools that claim to automate HEDIS abstraction, but they vary enormously in what they actually do and how far they move the needle on the underlying problem.
A tool that automates the retrieval of medical records is not the same as a tool that eliminates the need for manual record review. A tool that generates automated outreach lists is not the same as a tool that closes the gap between identifying an open measure and ensuring the needed care is delivered. Understanding the difference between these is the foundation of making a good technology decision.
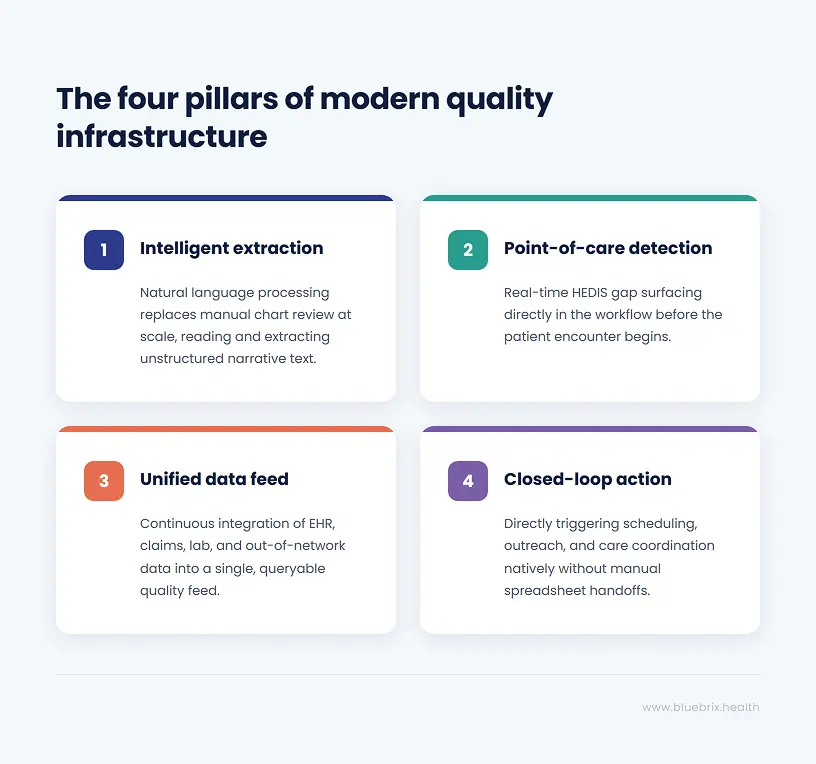
Here are the four pillars that define a modern quality measurement infrastructure:
Pillar 1: Using NLP to replace manual chart review at scale
The first pillar addresses the core bottleneck in the current process: the need for a human being to read through medical records to find measure-relevant information. Natural language processing technology can identify clinically relevant content in free-text documentation; notes, letters, reports, referral summaries all without requiring a human to read each document individually.
This does not eliminate the role of clinical expertise in abstraction. Complex and ambiguous cases still benefit from human review. But it changes what human review is reserved for. Instead of reading every record, abstractors focus on the genuinely complex cases where clinical judgment adds real value. Routine, high-confidence findings are handled automatically. The result is dramatically higher throughput at lower cost with better accuracy on the cases that matter most.
Pillar 2: Real-time HEDIS gap detection at the point of care
The second pillar addresses the timing problem. Quality gap information needs to surface in the clinical workflow before the patient encounter, not after it. When a care team sees a patient, they should see which HEDIS measures are open for that patient. When a care coordinator reviews their caseload, they should see which patients are overdue on quality measures and have not been seen recently.
This requires the quality measurement logic to be embedded in the clinical workflow, not running as a separate system that produces reports after the fact. The measure determination happens in real time as clinical data is documented. The gap is identified and surfaced immediately. The care team has the information they need to address it during the encounter rather than six months later.
Pillar 3: Integrating EHR, claims, and lab data into a single quality feed
The third pillar addresses the data fragmentation problem. Quality-relevant clinical information exists in many places: the primary care EHR, specialist systems, lab feeds, pharmacy claims, hospital discharge records, and care management documentation. A quality measurement system that only sees one of these sources will systematically miss care that has been delivered and documented elsewhere.
Modern quality infrastructure needs to ingest and reconcile data from all relevant sources, mapping it to measure criteria automatically and continuously. This includes structured data from EHR integrations, claims and encounter data from administrative feeds, lab results from clinical laboratory interfaces, and unstructured data from document feeds and clinical notes processed with NLP.
Pillar 4: Closed-loop care gap closure
The fourth pillar connects measurement to action. Identifying an open care gap is only valuable if it leads to something like an outreach call, a care management intervention, a provider notification, a scheduled appointment. In many organizations today, the gap between identifying a gap and closing it requires a manual handoff from the quality team to the care coordination team, often via an exported spreadsheet that sits in someone’s inbox.
Modern quality infrastructure integrates gap identification with outreach, appointment scheduling, care plan management, and care coordinator workflows on a single platform. The gap is identified, the appropriate intervention is triggered automatically, the outreach is tracked, and the closure is documented; all within the same system, without manual handoffs between disconnected teams.
The four pillars work together as a system. AI-assisted abstraction without real-time workflow integration is a faster version of the same retrospective process. Real-time gap detection without integrated data misses too many gaps to be reliable. Closed-loop closure without the first three pillars has nothing to close on.
Is your quality team ready to automate? A self-assessment checklist
Before evaluating platforms or making investment decisions, it is worth understanding precisely where your current infrastructure is breaking down. The following questions are designed to help quality leaders identify their most acute gaps and prioritize what needs to change first.
Work through these honestly with your team. The answers will tell you a great deal about where your quality performance is being lost and what kind of solution will actually move the needle.
Questions about your data infrastructure and timing
- How old is the quality data your team is currently making decisions from? Are you working from a live feed or a snapshot from the last abstraction cycle?
- How many days, on average, does it take from the time a clinical service is delivered to the time that service is reflected in your quality reporting?
- What percentage of your HEDIS numerator data comes from administrative claims versus supplemental clinical data? Do you know whether supplemental data is being submitted for all the measures where it would add value?
- How are you currently capturing quality-relevant data from specialist encounters and out-of-network services? What happens to that data after the encounter?
- If a patient in your attributed population completed a diabetic eye exam yesterday, how long would it take your quality system to reflect that the measure is now met?
Questions about your abstraction process
- What percentage of your quality team’s capacity is consumed by chart retrieval and review during peak abstraction season? What would those staff be doing with that time if the abstraction function were automated?
- What is your current inter-rater reliability rate on your most complex measures? How does that vary across different abstractors and across the abstraction cycle?
- How many temporary contractors do you hire for abstraction season? What is the error rate for newly trained abstractors versus experienced ones?
- What happens to abstraction findings after the submission deadline? Do they feed back into care management or quality improvement programs, or do they effectively disappear?
Questions about care gap closure timing
- At what point in the measurement year do you typically begin proactive outreach to members with open care gaps? Is this before or after the midpoint of the year?
- How are open care gaps communicated to care teams at the point of patient encounter? Does the provider see open gaps before the visit, during the visit, or not at all until after the measurement year?
- What percentage of your identified care gaps are closed through proactive outreach versus being discovered retrospectively during abstraction? What would it take to shift that ratio?
Questions about your current technology stack
- How many separate systems are involved in your end-to-end quality measurement process, from data capture to final submission? How many manual handoffs happen between those systems?
- Is your quality measurement infrastructure integrated with your care coordination platform? Can a care coordinator see open HEDIS gaps for a patient they are actively managing?
- When NCQA updates measure specifications, how long does it take your team to implement those changes in your abstraction workflows? How do you manage the transition period?
If your honest answers to these questions reveal that your quality data is months old, that your abstraction function consumes most of your quality team’s capacity, and that your care gap closure efforts are happening too late in the measurement year to maximize impact, you are not facing a staffing or process problem. You are facing an infrastructure problem. And infrastructure problems require infrastructure solutions.
How to evaluate HEDIS abstraction software: automation vs. real intelligence
The market for HEDIS and Stars quality management technology has grown significantly in recent years, and the range of what different tools actually deliver is wide. Some tools genuinely solve the underlying infrastructure problem. Others automate steps within the existing manual process without changing its fundamental limitations. Understanding the difference is critical to making a decision that moves the needle rather than just spreading the pain differently.
Process automation vs. quality intelligence: what’s the difference?
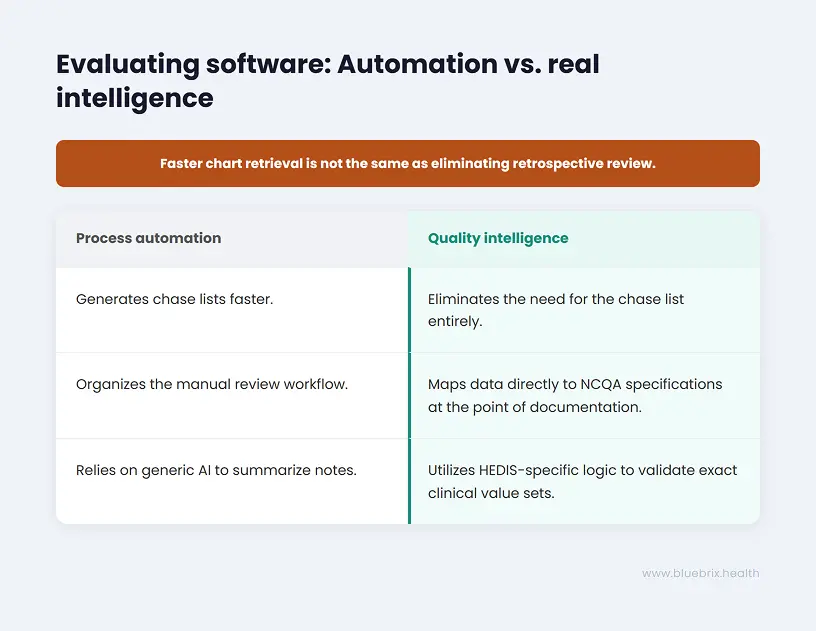
Process automation tools accelerate or streamline steps in the existing manual abstraction workflow. They might automate the generation of chase lists, coordinate medical record retrieval outreach, provide an abstractor interface that organizes the review workflow, or export results in the format required by the HEDIS reporting engine. These tools reduce the cost and time of manual abstraction. They do not address the fact that the abstraction is happening retrospectively, after the measurement year has closed, when there is no longer any opportunity to close the gaps being discovered.
Quality intelligence platforms take a different approach. Instead of automating the manual process, they replace its underlying logic. They capture and structure clinical data at the point of documentation, map it to measure criteria in real time, identify gaps before they become permanent misses, and surface actionable information to the care team while there is still time to act on it. The distinction matters enormously for organizations evaluating technology in this space.
Key questions to ask any HEDIS vendor
- Does the platform capture quality-relevant data at the point of care, or does it extract it retrospectively? The answer to this question determines whether you are buying a better abstraction tool or a fundamentally different approach.
- How does the platform handle measure specification updates from NCQA and CMS? Does it require manual workflow updates, or are specification changes applied automatically? The operational cost of managing annual measure updates is significant and often underestimated.
- What is the platform’s approach to unstructured clinical data? Does it use NLP to identify measure-relevant content in narrative notes and documents, or does it rely exclusively on structured data fields? A platform that cannot read free-text documentation will systematically miss a significant portion of clinically relevant information.
- How does the platform integrate with existing EHR systems and clinical data sources? Does it require replacing existing systems or does it layer on top of them? Integration complexity is a major source of implementation risk and ongoing cost.
- Does the platform connect quality measurement to care coordination? Can a care coordinator working in the platform see open HEDIS gaps for the patients they are managing and act on them within the same workflow?
- What does the platform’s audit trail look like? For every measure determination, can you trace the finding back to the specific source documentation? This is critical for managing audits and disputes efficiently.
Why generic AI tools fall short on HEDIS measure specificity?
A particular caution deserves emphasis here. Generic AI coding and clinical documentation tools are not designed for the precision that HEDIS and Stars performance requires. A general-purpose AI tool might suggest a diagnosis code of “Diabetes” where a specific value-based contract requires “Type 2 Diabetes with Stage 3 Chronic Kidney Disease.” The clinical meaning is similar. The coding specificity required is not. And in a risk-adjusted, quality-measured environment, that specificity is where revenue lives.
The right platform is one whose quality measure logic is encoded against the actual NCQA technical specifications and CMS Stars measure definitions, updated when those specifications change, and validated against specific payer contract requirements rather than a generic standard. This is not a capability that general AI platforms offer out of the box. It requires deep domain-specific engineering.
Ask every vendor: what happens when a measure specification changes? How many manual steps does your team need to take? The answer tells you whether you are buying automation or intelligence.
How are health plans improving HEDIS scores with real-time quality management?
The transition from manual abstraction to real-time quality intelligence is not theoretical. Organizations across the Medicare Advantage, ACO, and managed care landscape have already made it and are seeing the results in their performance data, their team retention, and their ability to manage quality as a continuous function rather than an annual crisis.
The patterns of what changes and what that change actually feels like inside a quality organization are consistent enough to be instructive for organizations that are considering making the same shift.
The quality director who got their team back
Consider a Medicare Advantage plan quality director managing a team of eight clinical quality specialists, plus a rotating cast of temporary contractors hired every January for abstraction season. Before implementing real-time quality infrastructure, her team spent roughly 60 percent of its capacity from January through June on chart retrieval, record review, and abstraction coordination. The remaining 40 percent was divided between the administrative overhead of running the abstraction program, responding to auditor requests, and whatever quality improvement work could be squeezed in around the edges.
After transitioning to a platform that captured quality-relevant data at the point of care and surfaced gaps in real time, the picture changed substantially. The volume of records requiring manual review dropped by more than 70 percent, concentrated on genuinely complex cases where clinical expertise added real value. The team’s capacity that had been consumed by routine abstraction was redirected toward care gap outreach programs, provider coaching, and population health analysis. Measure performance improved not because the abstraction got better, but because the team was now doing quality improvement work instead of quality measurement work.
Equally important: turnover on the quality team dropped significantly. The experienced clinical specialists who had been quietly looking for roles that did not involve four months of chart review every year stopped leaving.
The ACO that stopped flying blind
An accountable care organization managing approximately 40,000 attributed lives across a multi-specialty provider network had a different version of the same problem. Their quality team knew, in broad terms, how they were performing on HEDIS measures. What they did not have was the ability to see performance at the provider level, in real time, broken down by specific measure and patient cohort, in a way that was actionable for their network management team.
Provider performance conversations were happening annually, based on data that was more than six months old by the time it was presented. Providers could not verify the findings against their own records in real time. Quality improvement agreements were made on the basis of historical data that neither party was confident was accurate.
After implementing real-time quality dashboards fed by continuous data from the clinical systems across their network, the ACO’s network management team had a fundamentally different tool for provider engagement. Quality performance data was current, traceable to specific encounters, and visible to both the plan and the practice simultaneously. Conversations about quality improvement shifted from adversarial to collaborative because both parties were working from the same real-time data. Measure performance in the two years following implementation showed consistent improvement across the network’s highest-volume primary care practices.
The plan that caught the gap before it became a miss
One of the most concrete illustrations of the year-round quality model’s value comes from organizations that have used real-time gap detection to intercept specific high-risk patients before a measure miss becomes permanent.
A regional Medicare Advantage plan implemented real-time HEDIS gap tracking integrated with its care coordination platform. In month seven of the measurement year, the system identified a cohort of several hundred members who were overdue on diabetes care measures and had not had a primary care encounter in more than four months. Automated outreach was triggered. Care coordinators followed up on cases where automated outreach went unanswered. A significant portion of the cohort completed the needed services before the measurement year closed.
Under the prior manual abstraction model, this cohort would have been identified in March of the following year, during abstraction season, when the measurement year was long closed and the only option was to document the miss. The shift from retrospective documentation to prospective intervention converted a performance loss into a performance gain. And it happened not because the quality team worked harder but because they had information earlier.
The common thread across every organization making this shift is the same: they stopped measuring quality after the fact and started managing it in real time. The performance improvement is a byproduct of the infrastructure change, not the other way around.
Stop wasting clinical talent on manual chart pulls - there is a better way
We started this article in a familiar place: the quality department in crisis mode, the spreadsheets multiplying, the compliance lead working late, the experienced nurses doing chart review work they did not train for and do not want to be doing. It is worth coming back to that image now with a different frame.
That scene is not inevitable. It is a consequence of a specific infrastructure choice. The choice to measure quality retrospectively, with manual human review, on a batch cycle that runs once a year. That choice made sense in the era before widespread EHR adoption and structured clinical data. It does not make sense now. And the organizations that continue to make it are not just accepting an operational inconvenience. They are accepting a structural limitation on what their quality function can accomplish.
The abstraction cycle consumes the capacity that quality teams need to run improvement programs. It produces information too late to act on. It generates errors that understate actual performance. It burns through the talented, trained professionals who could be designing interventions, coaching clinical teams, and doing the work that actually moves patient outcomes. And it does all of this while consuming seven figures of organizational budget annually.
The shift that is available right now
The infrastructure required to move from retrospective manual abstraction to real-time quality intelligence exists and is being implemented by organizations across the Medicare Advantage, ACO, and managed care landscape today. It is not a future capability waiting for technology to mature. It is available now, and organizations that implement it are already seeing the results in their Star Ratings, their team retention, and their ability to close care gaps proactively rather than document them retrospectively.
The core shift is architectural: from extracting quality data after the fact to capturing it at the point of documentation. From identifying care gaps months after they become permanent to surfacing them in real time while there is still time to act. From running quality measurement as a separate, annual reporting exercise to embedding it in the care delivery workflow where it can actually influence what happens next.