
The paradox at the heart of value-based care
You’re managing risk now. Maybe it’s a Medicare Shared Savings Program (MSSP) ACO contract. Maybe you’ve taken on risk through Medicare Advantage or a direct primary care model. The promise is clear: better outcomes, lower costs, shared savings.
The reality? Your team is drowning in evidence collection. HEDIS scores, SDoH loop-closure data, patient outcome metrics, quality measure reporting, care gap documentation, referral tracking, risk adjustment files, compliance audits and what not!
And here’s the trap: The more quality evidence you need to prove, the more time your staff spends gathering, verifying, and documenting that evidence, instead of actually delivering care that improves outcomes.
In reality, a mid-sized ACO with 50,000 attributed lives might spend over 100,000 annual person-hours just preparing quality reports for external agencies. Meanwhile, as we head into 2026, we’re increasingly seeing healthcare providers reporting time lost to unproductive charting and burnout as a major healthcare challenge, second only to the cost of care itself.
This isn’t a documentation problem. It’s a quality evidence problem. And it’s costing you two things: staff burnout and missed financial incentives because you’re too busy chasing charts to close actual care gaps.
If this sounds familiar, you’re not alone. This guide reveals why the documentation burden exists, what it’s really costing your organization, and how integrated systems can transform quality evidence collection from a liability into a competitive advantage.
Understanding the documentation burden in value-based contracts
Documentation burden has escalated dramatically since the widespread adoption of EHRs and the shift to value-based payment models. Today’s healthcare organizations face continuous, multi-stakeholder quality reporting requirements that bear little resemblance to the annual submissions of a decade ago.
Here’s why:
HEDIS measures now require claims data, medical records review, and patient outreach all year-round. NCQA has added seven new measures and transitioned four measures to Electronic Clinical Data Systems (ECDS) reporting for 2026, placing greater emphasis on preventive care, chronic disease management, and social determinants of health. For a single measure, organizations must identify eligible patients, extract data from multiple sources, reconcile records, and report to plans, all while maintaining audit-trail documentation. NCQA’s shift toward ECDS-only reporting by 2030, phasing out manual Hybrid measures. This means organizations must rapidly modernize their data infrastructure while still managing legacy reporting methods simultaneously.
Social Determinants of Health (SDoH) screening and loop-closure are now mandated by CMS and health plans. But screening alone isn’t enough—you must document the referral, track whether the patient received the service, and link outcomes back to the care record. This closed-loop requirement creates entirely new documentation workflows that weren’t contemplated even three years ago.
Risk adjustment coding demands that every relevant diagnosis be captured, coded, and submitted not just for billing, but to accurately reflect patient complexity in shared savings calculations. One missed diagnosis code can mean thousands in lost revenue.
Real-time quality tracking is no longer optional. Healthcare organizations now face expectations from NCQA and CMS for standardized, real-time clinical quality data analysis, shifting from batch annual reporting to continuous monitoring that identifies care gaps and tracks interventions as they occur.
The result? Healthcare workers now spend 30-50% of their time on non-clinical administrative tasks, according to 2025 research. For physicians in value-based payment models, the burden is particularly severe. Research from late 2025 shows that clinicians often spend two hours on paperwork for every hour of direct patient interaction. This is resulting in unproductive charting time and administrative overload, particularly for nurses.
The real cost: time, money, and missed savings
The financial impact is staggering and invisible on most balance sheets.
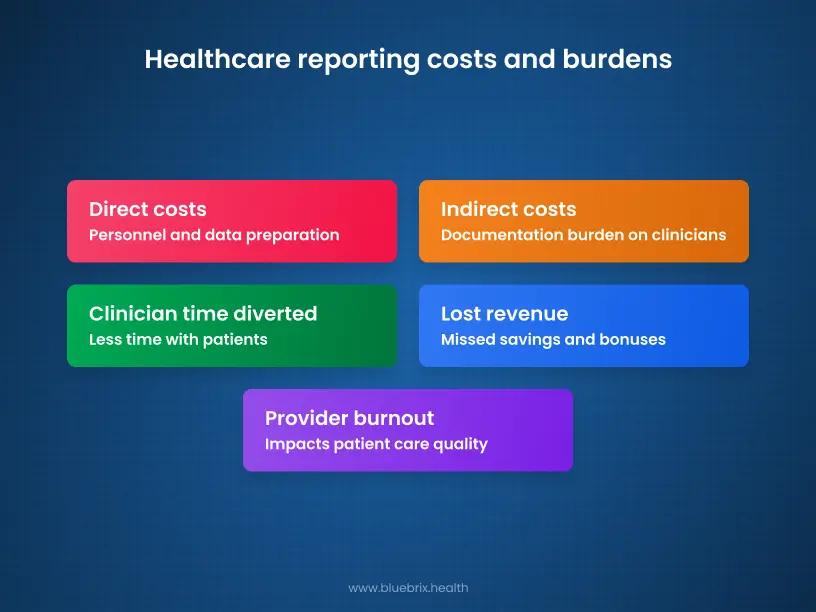
Direct costs of quality reporting:
Johns Hopkins Hospital calculated that preparing and reporting 162 unique quality metrics annually required approximately 108,000 person-hours and cost $5 million in personnel alone. For claims-based metrics specifically, costs ballooned to $35,000 per metric per year and that was just for data preparation, not quality improvement. As organizations transition to ECDS reporting while maintaining hybrid reporting through MY 2029, these costs are likely to increase further due to dual systems and parallel testing requirements.
Indirect costs of documentation burden:
- Clinician time diverted from care: According to Deloitte’s 2025 healthcare outlook, an estimated 15-28% of nurses’ work is made up of low-value administrative tasks. Hospital intensivists spend only 15-30% of their time with patients, with the rest consumed by documentation and administrative work. The AMIA 25×5 Initiative found that nearly 75% of healthcare professionals perceive that documentation impedes patient care quality.
- Provider burnout and turnover: Administrative tasks remain the leading cause of burnout. A Surescripts survey from September 2025 confirms that 73% of prescribers and 74% of pharmacists identify burnout as a major healthcare challenge. The U.S. Surgeon General’s 25×5 Initiative goal is to reduce documentation burden to 25% of its current state by 2025, yet as we enter 2026, healthcare organizations are still struggling with the inverse problem. Turnover costs associated with physician burnout are estimated at $4.6 billion annually across the U.S. healthcare system.
- Lost revenue opportunities: Teams so focused on gathering historical evidence for past performance have no capacity to close current care gaps missing shared savings targets and quality bonuses.
For example, an ACO coordinator spends 4 hours daily managing referrals, chasing missing test results, and reconciling care plans across disparate EHRs. That same coordinator could have identified 8-10 patients needing intervention during that time. Over a year, that’s thousands of missed quality opportunities and shared savings.
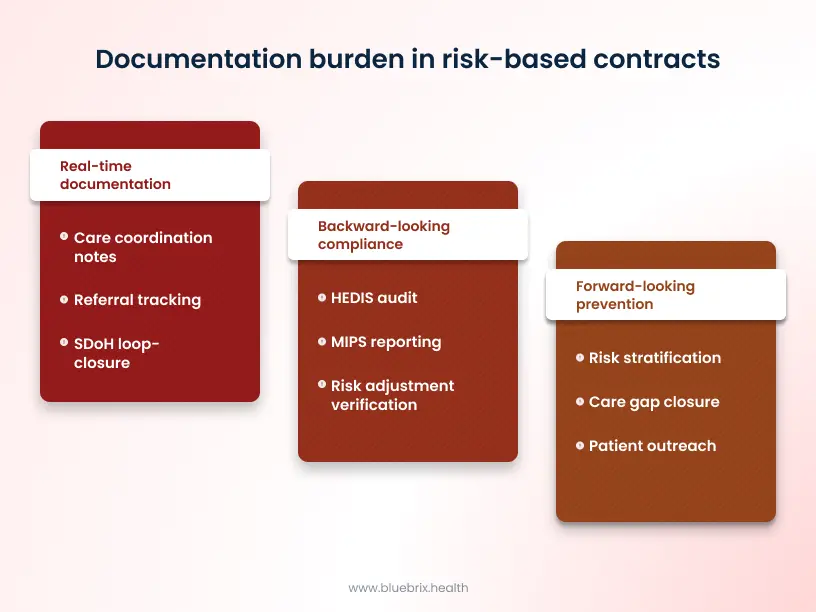
The three categories of documentation burden in risk-based contracts
1. Backward-looking compliance: proving what you already did
This is your annual HEDIS audit, your MIPS reporting, your risk adjustment verification. This is reactive documentation – gathering evidence of care that already happened to prove it met quality standards.
Data lives in multiple systems. Your EHR has the clinical note, your claims system has the code, your population health platform has the risk score. Pulling it all together requires manual chart review, data validation, and often significant rework when documentation doesn’t align across sources.
2. Forward-looking prevention: identifying and addressing care gaps
This is your risk stratification, your care gap closure, your patient outreach. It’s proactive – identifying which patients need intervention to avoid costly events.
Identifying care gaps requires unified data across claims, clinical records, social services, and sometimes external health information exchanges. If data is siloed, you miss high-risk patients until they show up in the ED.
Time sink: Care coordinators manually review patient rosters, cross-reference care gap lists, and chase missing data points, often duplicating work already done elsewhere.
3. Real-time documentation: recording interventions as they happen
This is your care coordination notes, your referral tracking, your SDoH loop-closure documentation. It’s transactional – documenting each touchpoint to prove the intervention occurred and maintaining an auditable record for compliance.
When systems aren’t integrated, coordinators document in the EHR, then re-enter the same information into referral systems, care management platforms, and compliance tracking spreadsheets. Redundant documentation, version control nightmares, and compliance gaps.
Time sink: 16-30 minutes per patient encounter just on documentation, with much of it duplicated across systems.
The three hidden traps of fragmented quality evidence
Trap #1: Data silos masquerading as integration
You have an EHR. You have a claims system. You might have a population health platform and a referral management tool. In your mind, they’re “integrated.” In reality, they’re siloed systems with fragile connection points and the connective tissue is manual work.
Here’s what this looks like in practice:
A patient is flagged for a HEDIS measure (e.g., colorectal cancer screening). The measure is identified by your population health system, but the clinical decision support in your EHR doesn’t know about it. Your care coordinator has to manually check a separate report, then search the EHR for the patient’s record, then determine if the required screening already happened. If the patient went to an out-of-network provider, you might not have the data at all triggering outreach to external organizations and manual record requests.
Multiply this across 90+ HEDIS measures, thousands of patients, and dozens of staff members, all checking different systems for the same data, and you’ve created massive inefficiency.
The cost: About 50% of care coordinator time is spent searching for or re-entering data that already exists somewhere in their ecosystem.
The opportunity loss: While coordinators are searching for data, high-risk patients miss interventions. The window for preventing a readmission closes. A CMS quality measure gap goes unclosed. A patient misses a preventive screening because the referral is stuck in a coordinator’s email inbox instead of flowing through an integrated system.
Trap #2: Compliance documentation consuming resources meant for quality improvement
Here’s the dangerous paradox: The more you document, the more evidence you have. But that evidence is often historical proof of what you should have done, not actionable data for what to do next.
For example, your HEDIS audit shows that 68% of diabetic patients had an HbA1c test. But that audit happens months after year-end. Your staff spent weeks gathering records to prove that screening happened. They didn’t spend time identifying the 32% who were missed and why and potentially reaching them for the current year.
Studies consistently show that healthcare professionals perceive only 36% of quality registrations as actually useful for improving care. The rest are compliance obligations that eat into time that could be spent on real improvement. With NCQA expanding HEDIS measures and adding new data collection requirements for 2026, this compliance burden is only intensifying.
The risk: You meet your HEDIS targets (compliance), but you don’t improve care gap closure rates or readmission prevention (actual outcomes). You’re optimizing for the metric, not the patient.
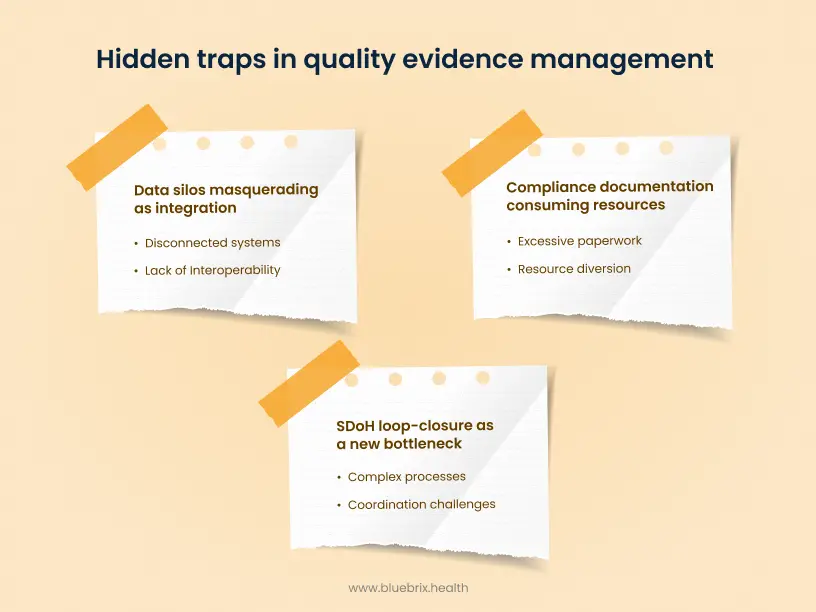
Trap #3: SDoH loop-closure as a new bottleneck
Social determinants of health screening is critical. But closing the loop—documenting that a referral was made, that the patient received the service, and that outcomes changed—is creating an entirely new documentation burden.
Current state: A patient screens positive for food insecurity. Your coordinator makes a referral to a community food bank. Then what?
Without a closed-loop system, your care team has no visibility into whether the patient actually connected with the service. The referral goes into a spreadsheet. Maybe the food bank reports back; maybe they don’t. Even if they do, that outcome data lives in a separate system and never makes it back to the clinical record.
Result? You’ve addressed the SDOH screening requirement (compliance), but you haven’t closed the clinical loop (outcomes). The patient’s health record doesn’t reflect that food insecurity was addressed, so future care decisions don’t account for this intervention.
The documentation burden: Creating structured fields for SDoH screening, manual referral tracking, outcomes reconciliation, and then re-documenting results in the clinical record.
How integrated systems eliminate the documentation trap
The principle: one source of truth, automatic evidence generation
The solution isn’t more documentation. It’s smarter documentation, where quality evidence is generated automatically from clinical workflows, rather than manually extracted from fragmented records.
Here’s how truly integrated systems work:
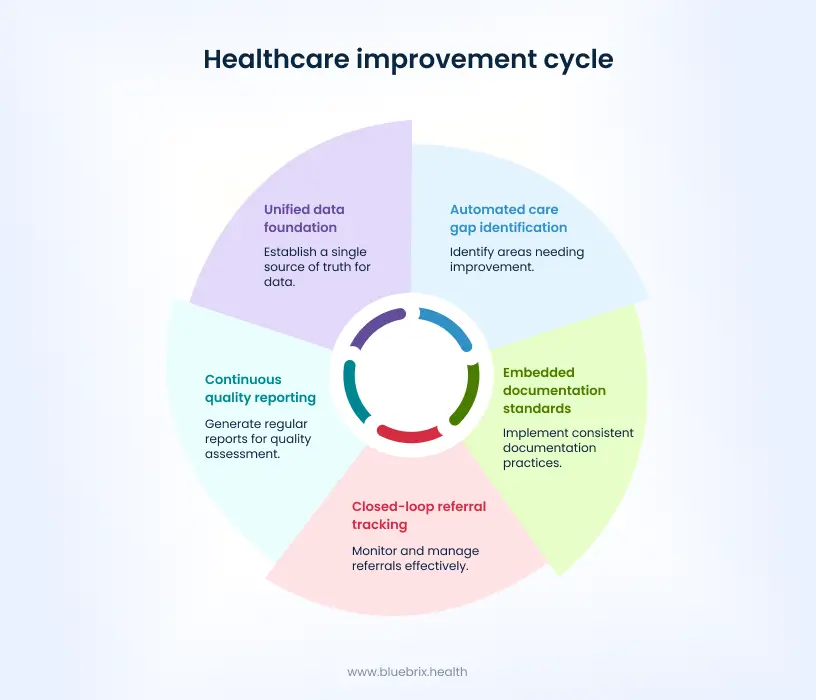
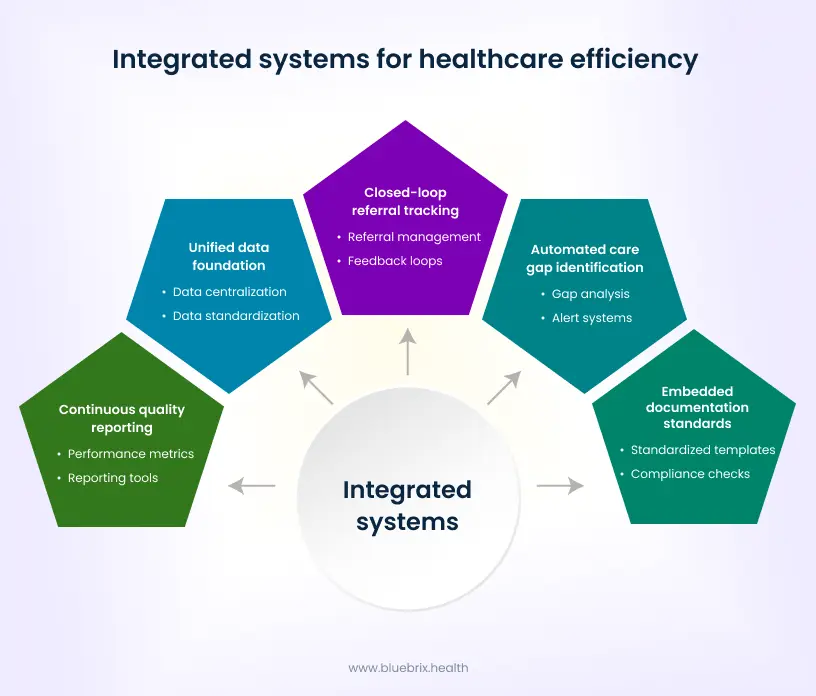
Step 1: Unified data foundation
Instead of separate systems for EHR, claims, population health, and referral tracking, an integrated platform creates a single source of truth where all patient data including clinical, claims, social, behavioral, flows continuously and securely.
Result: When a care coordinator needs to assess a patient’s readiness for a diabetes intervention, she doesn’t search multiple systems. She opens one comprehensive patient view showing clinical status, recent labs, medication adherence, social barriers, and prior care plan.
Step 2: Automated care gap identification
AI and predictive analytics continuously scan patient data to identify care gaps as they emerge, not months later during an audit.
For example, a patient with diabetes hasn’t had an HbA1c test in 8 months (a HEDIS gap). The system flags this automatically and assigns it to the right care coordinator. The patient gets contacted for a timely intervention.
Result: Proactive care gap closure instead of reactive audit findings.
Step 3: Embedded documentation standards
Quality evidence requirements (HEDIS coding, SDoH Z-codes, risk adjustment fields) are embedded directly into clinical workflows. Clinicians don’t document separately for compliance—they document once, and the system extracts evidence automatically.
For example, when a clinician documents a patient’s housing situation in a structured field (part of routine SDoH assessment), that data automatically populates SDOH coding, care plan goals, and referral tracking.
Step 4: Closed-loop referral tracking
Referrals to community resources, specialists, or follow-up care are created in the system, tracked in real-time, and automatically reconciled when services are delivered.
For example, a referral for physical therapy is placed. The system automatically sends the referral to the PT provider, tracks appointment confirmation, and marks the referral as “closed” when the PT submits completion notes. The patient’s record automatically reflects that the care gap was addressed.
Step 5: Continuous quality reporting
Instead of scrambling to prepare data for annual reporting, the system generates real-time dashboards showing performance on HEDIS, quality metrics, care gap closure rates, and SDoH outcomes. As NCQA transitions to ECDS-only reporting by 2030, organizations with continuous data feeds are positioned to make this transition far more efficiently than those relying on manual data extraction.
Result: Executives know exactly how they’re performing against shared savings targets and can adjust care strategies in real-time.
Impact
Organizations implementing integrated care coordination systems report:
- 40-50% reduction in documentation time for care coordinators and clinical staff, because data entry is automated and duplication is eliminated.
- 22-30% improvement in readmission rates when high-risk patients are identified automatically and assigned for proactive intervention, rather than discovered after readmission occurs.
- 15-25% increase in quality metric performance (HEDIS, Star ratings) when care gaps are closed proactively rather than reactively identified during audits.
- $89-$422 per member per month in net savings for coordinated care programs focused on high-risk populations, derived from reductions in ED visits, hospitalizations, and preventable utilization.
- 200%+ ROI on care coordination investment when administrative efficiency gains are combined with quality bonuses and shared savings.
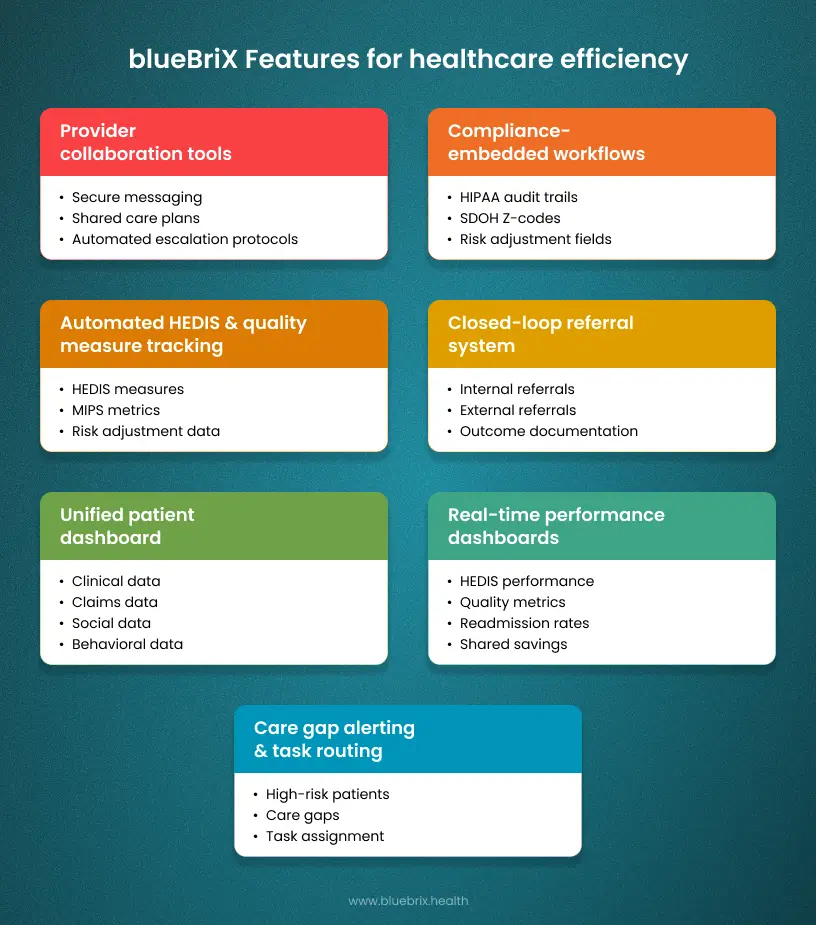
How does blueBriX resolve the quality trap?
blueBriX is specifically designed to address the documentation burden in value-based contracts through intelligent care coordination orchestration.
Here’s how we solve the three traps:
Solving Trap #1: fragmentation and data silos
The Problem: Your EHR, claims system, population health tools, and referral systems don’t talk to each other, forcing staff to manually consolidate data.
The blueBriX Solution:
- Unified Care Coordination Platform: We integrate with your existing EHR, claims systems, and health information exchanges to create one comprehensive patient view.
- FHIR-Enabled Interoperability: We use modern interoperability standards (FHIR, HL7, API-led connectivity) to pull data from multiple sources in real-time, without forcing system replacement. As healthcare systems prepare for ECDS-only HEDIS reporting by 2030, blueBriX’s FHIR-native architecture positions your organization for the future of digital measurement.
- Automated Data Harmonization: Patient data from different sources is automatically reconciled and updated in real-time, eliminating the manual consolidation work.
For example, a care coordinator opens the blueBriX dashboard and sees one patient view – clinical status, HEDIS care gaps, SDoH needs, active referrals, and prior interventions. She doesn’t toggle between three systems but has everything in one place.
Solving Trap #2: Compliance vs. Improvement
The Problem: Your team spends weeks documenting historical compliance without time for proactive improvement.
The blueBriX solution:
- Embedded quality standards: HEDIS coding, MIPS measures, risk adjustment requirements, and SDoH documentation are built into care workflows, not separate compliance tasks. As NCQA adds new measures for 2026, blueBriX’s flexible measure engine allows you to adopt new quality measures rapidly without system reimplementation.
- Real-time care gap alerts: The system continuously identifies patients who need intervention for quality metrics and automatically assigns them for proactive care.
- Evidence-based workflows: Care pathways are designed around quality metrics, so when clinicians follow the workflow, they’re simultaneously delivering quality care and generating auditable evidence.
For example, your diabetes care team uses a standardized HbA1c management protocol in blueBriX. When a patient hasn’t had a recent HbA1c test, the system flags the gap, the care coordinator reaches out proactively, and once the test is ordered and resulted, the HEDIS measure is automatically satisfied.
Solving trap #3: SDoH Loop-closure complexity
The problem: You screen for social determinants but lack visibility into whether patients actually receive services and whether outcomes improve.
The blueBriX solution:
- Closed-loop referral management: Referrals to community-based organizations are created in blueBriX, tracked through the referral process, and automatically marked as closed when outcomes are reported.
- SDoH data integration: Data from community partners flows back into the clinical record, so clinicians know which social needs were addressed and can adjust care plans accordingly.
- SDOH-to-outcome linkage: blueBriX connects SDOH interventions to clinical and financial outcomes (e.g., housing support linked to reduced ED visits), so you can prove ROI.
For example, a patient screens positive for transportation barriers. blueBriX automatically suggests community transportation programs, creates a referral, tracks whether the patient connected, and documents the outcome in the health record. If the patient’s missed appointments subsequently improve, that impact is measured and reported.