

Your CFO asks in June 2026: “Should we invest $500K in expanding our care management program for 2027?” The honest answer requires knowing whether your 2025 performance was profitable. But that reconciliation report won’t arrive until late 2026. By then, hiring cycles are closed and program budgets are set.
This is the shared savings paradox: every strategic decision requires financial clarity you won’t have for another 9-12 months.
For 2026, this timing gap carries additional weight. While the reconciliation lag remains unchanged, the variables determining your performance are shifting in ways that make historical patterns less reliable predictors of future results.
This blog outlines how organizations are breaking that cycle using the data they already generate to forecast shared savings quarterly instead of waiting for annual reconciliation reports. Let’s start with why 2026 clock is ticking.
Key 2026 changes that will impact your shared savings
2026 is tightening the screws across the board: stricter quality thresholds, higher withholds, and less margin for error. The landscape is shifting in three critical ways that make this year fundamentally different from what came before. Organizations that treat 2026 like a continuation of 2024 or 2025 are setting themselves up for significant budget shortfalls.
The risk adjustment model is changing. Quality withholds are increasing. And the margin for error is shrinking. Let’s start with the variable that’s already eroding budgets before a single patient walks through the door.
Protecting the budget with HCC coding & V28
V28 risk adjustment is one piece of that equation, but it’s a significant one.
Starting this year, CMS moves to 100% implementation of V28, which raises the bar on documentation specificity. The model rewards granular clinical detail. “Type 2 Diabetes with Chronic Kidney Disease” now carries 3x the risk weight of generic “Type 2 Diabetes.”
For organizations with average documentation habits, that translates to 8-15% benchmark erosion. Your patients haven’t changed. Your costs won’t drop. But your budget will.
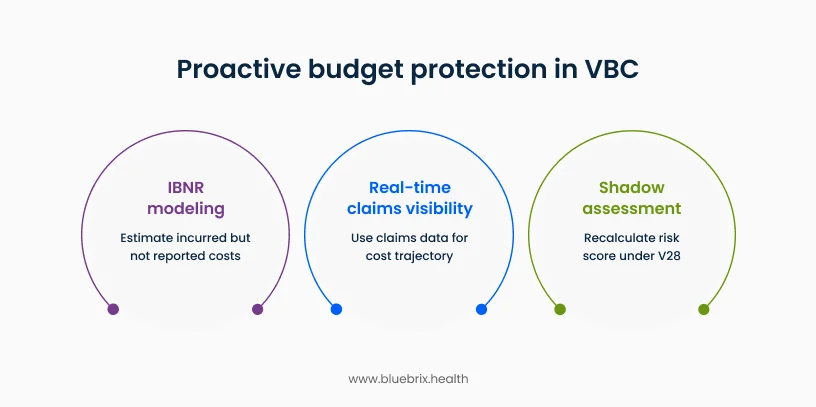
What’s actionable right now: Run a shadow assessment on a sample of high-complexity patients. Recalculate their risk scores under V28 rules. If you’re seeing material downgrades, you’ve got a documentation gap that’s directly eroding your 2026 benchmark.
The organizations addressing this in Q2-Q3 still have time to close those gaps before year-end. The ones waiting for reconciliation reports in 2027 are managing backwards.
Why this matters universally: Whether you’re in MSSP, Medicare Advantage, or commercial VBC arrangements, your budget is anchored to HCC-based risk adjustment. V28 isn’t an MSSP-specific issue. It’s foundational to how every value-based contract calculates expected cost. Get the risk scores wrong, and you’re managing to the wrong baseline regardless of your payer mix.
Cracking the glass box: real-time visibility with claims data
Most organizations wait 60-90 days for payer reports to understand cost trajectory. The teams proactively predicting shared savings are using data they already generate: claims and encounter feeds.
Here’s how it works. The 837 transaction shows what services were delivered at the moment they’re documented. Whether you’re submitting fee-for-service claims or capitated encounters, this is your utilization footprint in real time. ER visits up 12%? High-cost imaging spiking? You see it weeks before any payer report arrives
The EDI 835 shows what those services cost. Even in capitated or prepaid VBC arrangements where there’s no claim-by-claim reimbursement, payers provide this cost data as a shadow assessment – tracking what services would have cost for risk adjustment and total cost of care calculations. Reconcile the 837 with this cost data, and you’ve got total cost trend against benchmark, updated continuously.
Where this gets practical: The TRN (Trace Number) links cost data back to the original service. If patients are hitting out-of-network ERs 15% more than expected, you’re watching shared savings erode in real time. Spot it in June, intervene in July. Wait for the payer’s year-end report, and you’re managing a closed book.
The shift: use your own claims and cost data as leading indicators, not just billing records. That’s the difference between predictive forecasting and reactive reporting.
The actuarial “crystal ball”: mastering IBNR and ADT feeds
The 837 and 835 data show you what’s been documented and billed. But there’s a gap: care that’s already happened but hasn’t hit your billing system yet. That gap is called IBNR (Incurred But Not Reported), and it’s where most mid-year forecasts fall apart.
Managing the hidden tab: High-cost services like hospital stays and specialist procedures often lag 30-90 days between service delivery and claim submission. If you’re forecasting total cost of care in July based only on submitted claims, you’re missing a significant portion of June’s actual spend.
The organizations forecasting accurately use lag triangles to model this. They analyze historical patterns (how long does it typically take for an inpatient claim to appear?) and apply those patterns to current utilization to estimate the “hidden tab.” It’s not perfect, but it narrows the forecast range from plus or minus 15% to plus or minus 5-8%.
Real-time utilization alerts: ADT (Admission/Discharge/Transfer) feeds give you hospital alerts the moment your patient hits an ER or gets admitted. This is your earliest signal of high-cost events, often 48-72 hours before any claim data appears.
If a diabetic patient with a history of non-adherence shows up in the ER for the third time this quarter, that’s a care management intervention opportunity right now, not a retrospective data point three months later. More importantly, it’s a cost trend you can quantify immediately for your forecast model.
The mid-year checkpoint: By Q2 or Q3, the teams with visibility are running shadow assessments. They’re taking current utilization patterns, adding IBNR estimates, and projecting where total cost of care will land by year-end relative to benchmark. If the forecast shows you trending 3% over benchmark, you’ve got a quarter to tighten utilization management, address revenue leakage, or adjust care coordination resources.
Wait for the annual reconciliation report, and you’re reading about problems you can no longer fix.
You now have the core data infrastructure: accurate risk scores, real-time claims visibility, and IBNR modeling. But these are inputs. The question remains: what are you actually optimizing for? This is where many organizations stumble—they focus on one variable in isolation and wonder why performance doesn’t improve. Shared savings requires managing three interdependent levers simultaneously.
The 2026 VBC triad: the profitability equation
Shared savings isn’t a single-variable problem. You can’t just cut costs and expect to win. The organizations consistently hitting savings targets are managing three interdependent levers: revenue accuracy, quality performance, and cost control.
Revenue (HCC Accuracy): Your benchmark is set by how sick your population appears on paper. If your risk scores understate patient complexity, your budget is too low before you start managing care. We covered V28’s impact earlier, but the principle extends across all VBC models: accurate risk adjustment protects your baseline. A 10% risk score gap translates directly to a 10% benchmark shortfall.
Quality (HEDIS/Star Ratings): In 2026, CMS is raising the quality withhold to 5% in MSSP models. That means 5% of your shared savings is held back until you prove quality performance. Miss your quality benchmarks, and you’re not just leaving money on the table you’re getting taxed on the savings you did generate.
The multiplier effect matters. High quality performance doesn’t just unlock withheld dollars. It typically correlates with lower acute care utilization. Close a diabetes care gap, and you’re preventing an ER visit three months later. Quality and cost aren’t separate strategies – they’re mechanically linked.
Cost (MLR Control): Medical Loss Ratio is the percentage of your revenue spent on actual care delivery. In shared savings models, profitability requires keeping MLR below your benchmark-implied target. The pattern high-performers focus on: preventing acute events through proactive outreach rather than reacting to crises.
One high-cost ER visit for a poorly managed chronic condition can wipe out the margin from 20 well-managed patients. The math is unforgiving, which is why the organizations predicting savings accurately are tracking high-risk patient cohorts weekly, not annually.
The interdependence: You can’t optimize one lever in isolation. Improve HCC accuracy without quality performance, and you’ll hit the withhold wall. Control costs aggressively without quality focus, and you’ll trigger readmission penalties. The triad works as a system, and the forecasting models that ignore any leg are structurally incomplete.
Now that the conceptual framework is clear. The challenge is operational—how do you actually operationalize quarterly forecasting when your team is already stretched thin? This is where infrastructure matters.
How blueBriX enables shared savings forecasting and performance monitoring
The framework we’ve outlined – V28 risk adjustment, real-time claims visibility, IBNR modeling, and the VBC triad – works regardless of your technology stack. But the organizations moving fastest are the ones that automated the heavy lifting rather than building it manually in excel.
That’s why we built blueBriX.
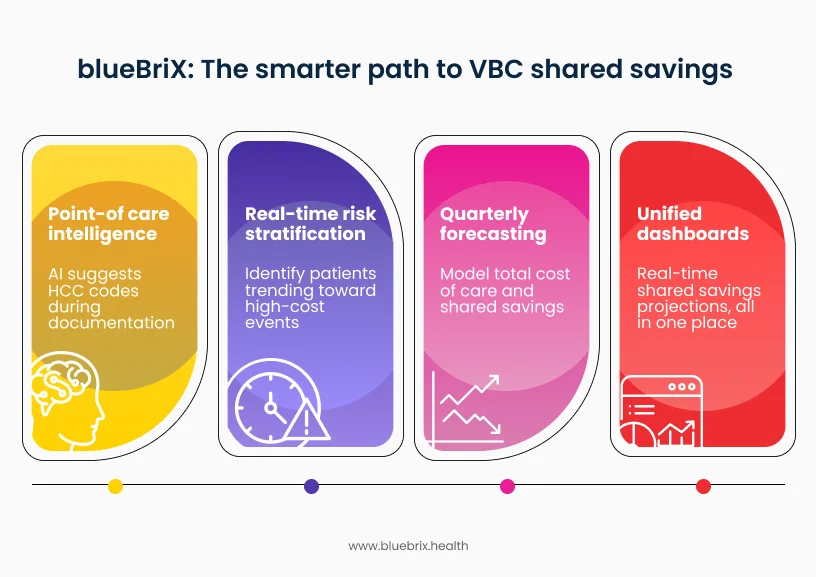
Point-of-care intelligence
As physicians document, blueBriX’s AI suggests HCC codes based on clinical notes. “Patient has diabetes” triggers: “Does this patient have diabetic neuropathy, retinopathy, or chronic kidney disease?” The provider captures V28-compliant specificity in real time, and the risk score reflects actual complexity. No manual abstraction, no missed codes.
Real-time risk stratification
Care managers see which patients are trending toward high-cost events before they happen. ADT alerts combined with claims patterns flag intervention opportunities while there’s still time to act. Prevent one avoidable ER visit or hospital readmission in Q2, and you’re watching that cost avoidance flow directly into your quarterly shared savings projection. More importantly, these early interventions compound – every prevented acute event keeps your MLR trending below benchmark.
Quarterly forecasting, not annual retrospectives
Because blueBriX is integration-agnostic, it can pull from your existing data sources – claims, clinical, quality measures, attribution lists. When this data flows in, the blueBriX platform can model your total cost of care (actual spend from 837/835 data plus IBNR estimates) against your risk-adjusted benchmark, apply quality withhold scenarios based on current HEDIS performance, and project shared savings or losses across conservative, moderate, and optimistic cases.
You’ll be seeing in Q2 whether 2026 performance is trending positive, neutral, or negative, with enough runway to adjust care management resources, close quality gaps, or address cost outliers before the year closes. You’re not waiting 15 months for reconciliation – you’re managing to a forecast that updates as new data arrives.
Unified dashboard
The CFO dashboard consolidates claims, clinical, and financial data into a single view. You’re not reconciling three spreadsheets from different departments to figure out where you stand on 2026 shared savings. You’re seeing projected performance updated continuously – conservative, moderate, and optimistic scenarios – so you can make program investment decisions in Q2 and Q3, not wait for the 2027 reconciliation report.
Full transparency: we built this because we kept seeing the same pattern. Finance teams had the data but couldn’t integrate it fast enough to make mid-year decisions. Clinical teams were documenting care but missing the specificity that protects the budget. The tools existed in silos. blueBriX brings them into one operational layer.
Why this matters for 2026: The V28 risk model and 5% quality withhold take full effect this year. Organizations that can forecast and adjust mid-year have intervention windows. Organizations waiting for 2027 reconciliation reports are managing closed books. The technology choice matters less than the timeline – can you operationalize predictive stewardship before Q4 2026?