

It’s Monday morning. You log into three separate systems, pull up a dashboard showing 847 metrics, and start triaging your caseload. Somewhere in that data is a patient 67 years old, two recent ED visits, a missed follow-up, a slow decline in medication adherence. The data is all there. But he doesn’t surface. Three days later, he’s readmitted. Not because your team wasn’t diligent. Because the system wasn’t built to show you what actually matters.
This is the real problem with analytics in healthcare. Not the absence of data, but the absence of visibility into what actually matters. At blueBriX, we’ve worked with care teams across value-based care programs and the pattern is consistent: organizations invest in analytics expecting transformation but get more dashboards instead of better decisions. The missing ingredient isn’t more data. It’s analytics that’s built around clinical action surfacing the right patient, at the right moment, inside the workflow where something can actually be done.
Operational analytics vs. clinical analytics: what's the difference
Before evaluating solutions, it helps to understand why most analytics platforms fall short in care coordination contexts. The core issue is that most platforms were built for operations, not for clinicians.
What operational analytics measures?
Operational analytics is designed around efficiency like throughput, appointment utilization, billing cycles, staff productivity, and cost-per-encounter. These are important metrics, and no health system can ignore them. But they answer the question “how efficiently are we running?” and not “how well are we caring?”
What clinical analytics measures?
Clinical analytics looks at the patient and their risk trajectory, care plan adherence, disease progression, gaps in treatment, and likelihood of deterioration. It answers the questions that care coordinators actually need answered every morning:
- Who among my patients is most likely to deteriorate in the next 30 days?
- Which care plans are silently failing, not being followed but not flagged?
- Where are transitions of care breaking down between providers?
- Which patients are slipping through the cracks between visits?
Clinical intelligence requires richer data, more sophisticated modeling, and critically tighter integration with actual clinical workflows. That is a much harder technical problem to solve. Organizations that try to coordinate care using operational analytics alone are essentially navigating by looking in the rearview mirror. They can see what happened. They cannot see what is about to happen.
The difference isn’t just philosophical. It shows up in five specific, high-stakes areas where clinical analytics consistently reveals what operational tools simply cannot.
Five clinical visibility gaps that break care coordination
For care coordination to be truly proactive, organizations need visibility into five specific areas that operational analytics consistently fails to illuminate.
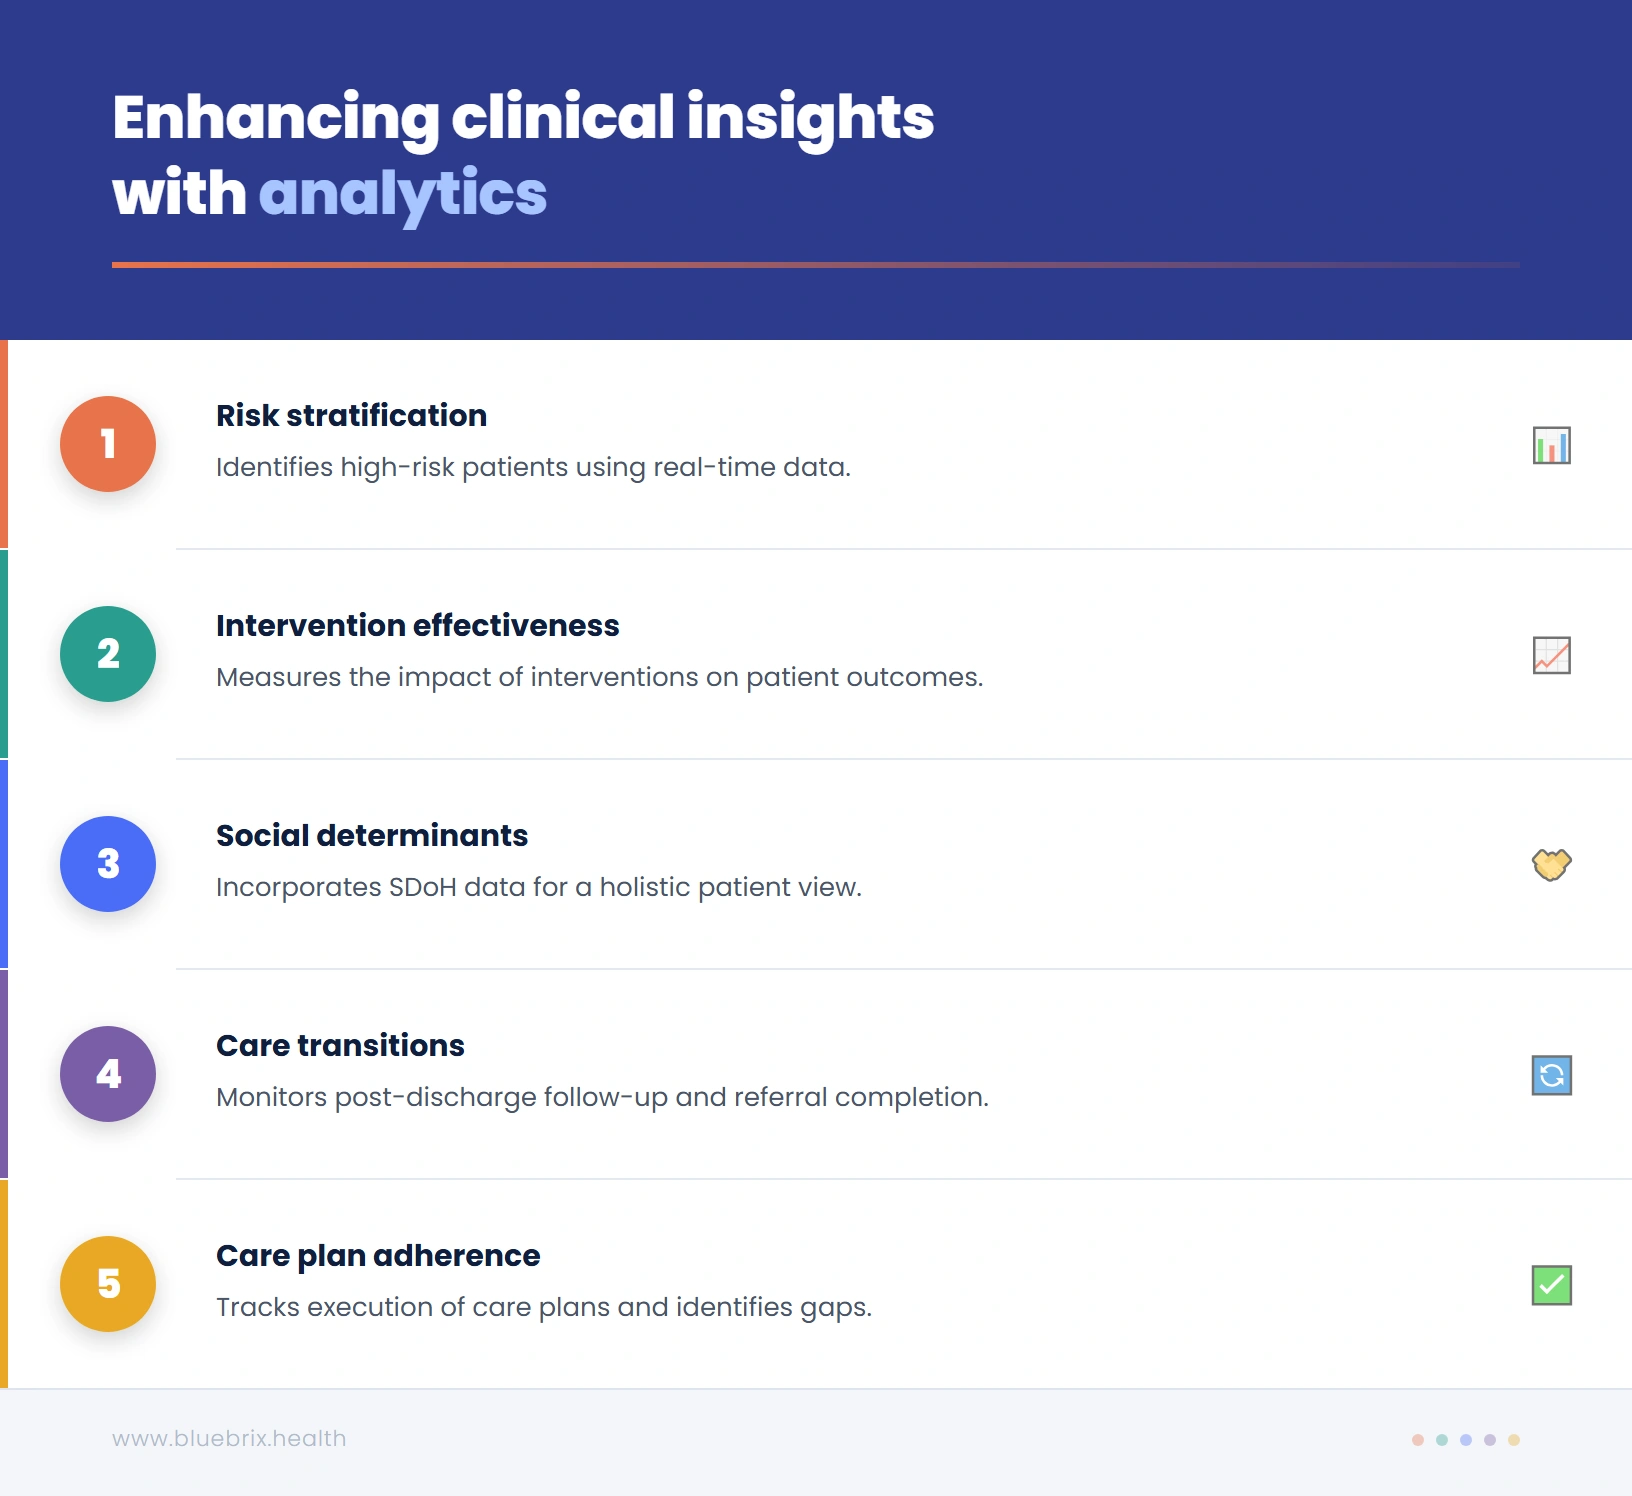
1. Which patients are actually at risk right now
Basic risk stratification often sorts patients by demographic proxies: age, number of diagnoses, insurance status. This produces broad categories but not actionable clinical intelligence. True risk stratification layers in real-time clinical signals like recent lab trends, vital sign patterns, medication fill rates, and behavioral data and produce a dynamic, continuously updated picture of patient risk. Without this, coordinators are triaging by assumption, not by evidence.
2. Where care transitions are breaking down
Hospital discharge is one of the highest-risk moments in a patient’s care journey. Yet most analytics platforms cannot tell you, in real time, whether a post-discharge follow-up was completed, whether the patient filled their prescription, or whether the specialist referral was acted on. These handoff failures are where readmissions are born and they are invisible to organizations without clinical analytics embedded into transition workflows.
3. Which care plans are being followed and which aren’t
A care plan that exists on paper but is not being executed is worse than no care plan, because it creates a false sense of security. Clinical analytics can surface adherence gaps: missed check-ins, skipped assessments, patient-reported symptoms that don’t match planned interventions. These are the early warning signs of a care plan that has drifted from the patient’s actual needs.
4. How social determinants are affecting your patients’ outcomes
A patient’s clinical data tells only part of the story. Food insecurity, transportation barriers, housing instability, and social isolation are among the strongest predictors of poor health outcomes, yet they are often entirely absent from analytics dashboards. A clinical lens means incorporating SDoH data alongside clinical records to give coordinators a complete picture of what a patient is actually dealing with between appointments.
5. Whether your interventions are working
This is perhaps the most undervalued dimension of clinical analytics. Most organizations can measure inputs like how many calls were made, how many care plans were completed, how many patients were enrolled. Very few can measure outcomes in a closed-loop way: did this specific intervention, for this specific patient, actually change the trajectory of their care? Without this feedback loop, care coordination cannot learn or improve.
But having visibility into these five areas is only half the problem. Even organizations that surface the right clinical signals often find that those insights never translate into timely action and that gap has its own name.
The insight-to-action gap: why good data doesn't automatically improve care
There is a gap that exists in nearly every healthcare analytics implementation, and it is the real reason care coordination fails even when data is abundant. We call it the insight-to-action gap. It works like this: an analytics platform identifies a high-risk patient and surfaces that insight on a dashboard. A coordinator logs into the dashboard perhaps hours later, after clearing other urgent tasks and sees the alert, and then has to manually create a follow-up task, document it in the EHR, and initiate outreach through a separate communication tool. By the time action is taken, the window for early intervention has narrowed or closed entirely.
The gap isn’t a data problem. It’s a workflow problem. Insights that are not embedded directly into clinical workflows are insights that get lost. Closing this gap requires what might be called closed-loop analytics: a system where:
- A risk flag automatically generates a coordinator task, not a dashboard notification, but an action item in the workflow they are already using
- Patient outreach is triggered automatically and tracked to completion
- Documentation is captured in the same workflow, not across systems
- Outcomes feed back into the risk model, so the system gets smarter over time
This is not a futuristic vision. It is what modern care coordination platforms are capable of delivering today, but only if the architecture is built around clinical workflows from the ground up, not retrofitted onto operational reporting tools. Closing that loop isn’t just a workflow design challenge. It requires a technology architecture built specifically around clinical action, not operational reporting. Here’s how to evaluate whether a platform actually delivers it.
What clinical analytics actually requires and how to evaluate if a platform delivers it?
Most analytics platforms are built around data reporting. That’s not the same as being built around clinical action. The difference shows up not in feature lists but in how a platform behaves at the moment a high-risk patient is identified. Does it create a notification on a dashboard, or does it generate an action inside the workflow where your coordinator already is? Evaluating that difference is how you separate platforms that inform from platforms that actually change outcomes.
| What to evaluate | blueBriX | Most platforms |
|---|---|---|
| Patient record | Single longitudinal record ingesting data from multiple systems in real time | Pulls reports from your existing EHR — always hours or days behind |
| How insights surface | Risk alert automatically generates a task in the coordinator’s active work queue | Risk alert appears on a separate dashboard — coordinator has to manually create a task |
| AI flexibility | Vendor-agnostic — run native, third-party, or your own AI models on the same platform | Locked into one AI model — no ability to swap or upgrade without rebuilding |
| Workflow configuration | Configured by operational teams using no-code tooling — no engineering dependency | Requires engineering or vendor involvement every time a workflow needs to change |
Ask any vendor you evaluate to demonstrate each of these end-to-end — not just show you a dashboard.
Gap 1: Knowing who is actually at risk right now
Basic risk stratification gives you categories like high, medium, low. What it doesn’t give you is urgency. A patient flagged as high risk three weeks ago may have stabilized. A patient flagged as medium risk yesterday may be deteriorating today. blueBriX’s risk engine runs continuously against a unified patient record, incorporating real-time signals like lab trends, medication adherence, ED utilization, and SDoH factors. High-risk patients surface automatically in your coordinator’s work queue. There is no manual filtering and no separate system to check. Your team stops reacting and starts intercepting.
Gap 2: Seeing where care transitions are failing
Hospital discharge is where readmissions are born and most platforms can’t see it happening in real time. If a follow-up appointment hasn’t been scheduled, a referral hasn’t been acknowledged, or a prescription hasn’t been filled, blueBriX flags it automatically as a priority action. Transition failures become visible before they become readmissions. That’s the difference between a platform that reports what happened and one that prevents what’s about to.
Gap 3: Knowing which care plans are actually being followed
A care plan that exists on paper but isn’t being executed doesn’t protect your patient. It just creates a false sense of security. blueBriX tracks every assessment, intervention, and patient touchpoint longitudinally and maps it against the active care plan. Coordinators see at a glance which plans are on track, which have drifted, and which patients haven’t had a meaningful touchpoint within the expected window. Not as a report. As a live view inside the workflow they’re already in.
Gap 4: Incorporating social determinants into clinical decisions
A patient’s clinical data tells only part of the story. Food insecurity, transportation barriers, housing instability are all among the strongest predictors of poor outcomes, yet most platforms don’t factor them in at all. In blueBriX, SDoH data is captured at intake, tracked over time, and built into the risk model alongside clinical data. Coordinators can connect patients to community resources directly from within the platform and every connection is documented in the longitudinal record. Your team finally has the full picture, not just the clinical half of it.
Gap 5: Measuring whether your interventions are actually working
Most organizations can measure inputs like calls made, care plans completed, patients enrolled. Very few can measure outcomes in a closed loop: did this specific intervention, for this specific patient, actually change their trajectory? In blueBriX every intervention is tied to the patient’s longitudinal record and tracked against outcome metrics. Coordinators see whether a care plan adaptation reduced a patient’s risk score. Program managers see which protocols are producing the best outcomes at population level. This is how care coordination stops just operating and starts improving.
Ready to see what clinical visibility looks like inside a real care coordination workflow?
We’ll walk you through exactly how blueBriX works within your program’s context. This is not a generic product tour. It will be a focused look at the problems you’re actually trying to solve.
Schedule a demoWhat implementation actually looks like
One of the most common concerns is the fear that a platform transition will disrupt existing workflows, require months of downtime, or demand extensive custom development before delivering value. Here is what blueBriX implementation actually involves:
Integration without disruption
blueBriX connects to existing EHR systems including Epic, Athena, Salesforce, and others through FHIR, HL7, CSV, and REST APIs. It is designed to operate as a full platform or as a layered solution that fits into your existing technology stack. Organizations can start with specific programs and expand over time without rearchitecting their systems.
Configuration, not customization
Workflows, assessments, care plan templates, risk thresholds, and reporting views are configured through blueBriX’s no-code/low-code tooling by operational and clinical staff, not engineering teams. This means programs can be stood up, adapted, and expanded quickly, and the platform can evolve as care models change without vendor dependency.
Time to value
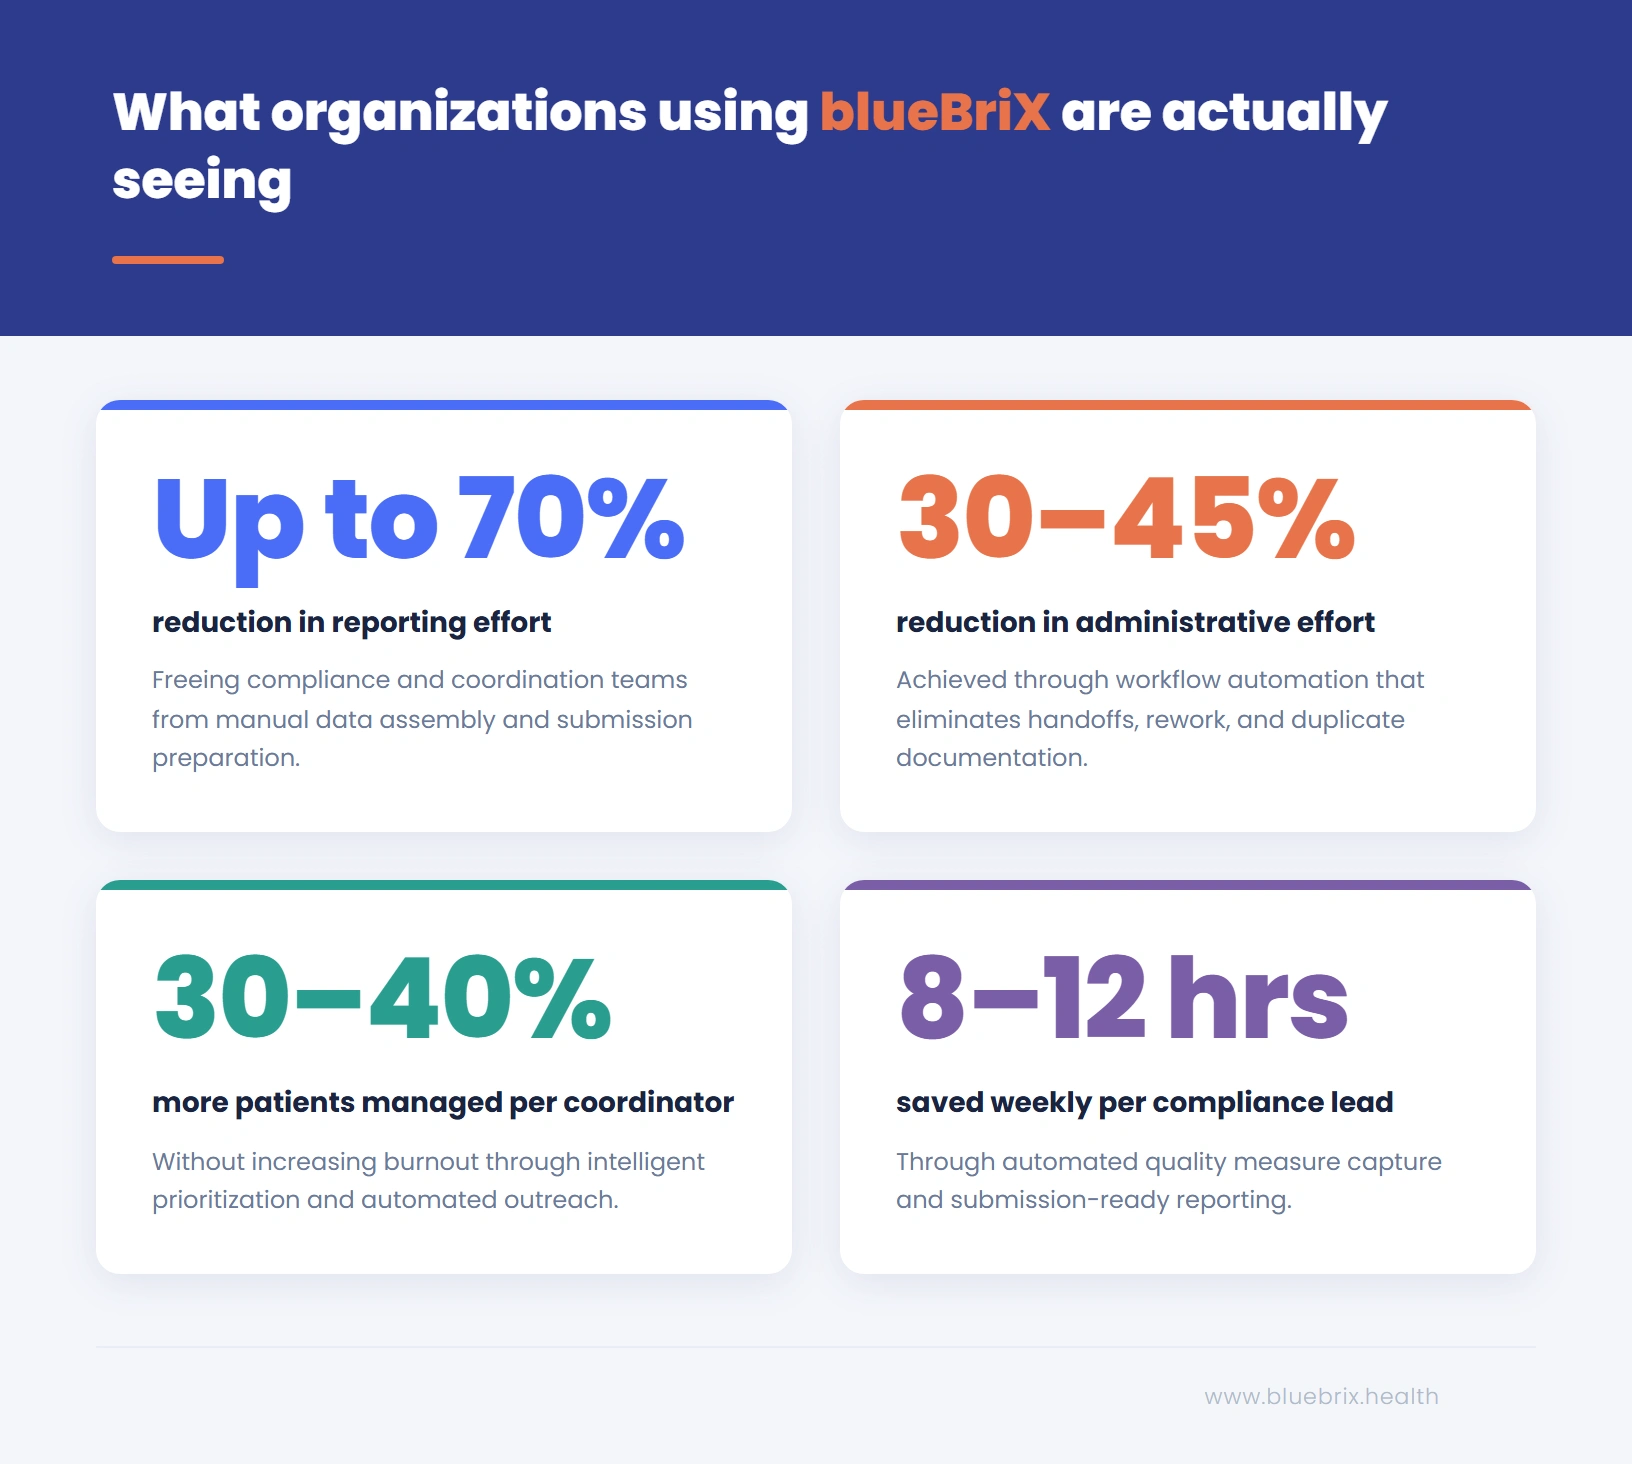
Organizations typically see operational improvements within the first 90 days of deployment. Coordinators will manage more patients, fewer missed follow-ups, automated compliance documentation reducing manual effort. Outcome-level impact, such as measurable reductions in readmission rates or quality measure improvements, typically materializes within six to twelve months, depending on population complexity and program scope.
Scale and compliance built in
blueBriX is HIPAA-compliant, GDPR-ready, and ISO-certified. Its architecture supports deployment across multi-provider networks and ACOs ecosystems without loss of data fidelity or compliance integrity. For organizations managing complex, multi-entity programs, the platform scales without requiring bespoke solutions for each entity.
The technical foundation is there. The compliance is built in. The path to go-live is shorter than most organizations expect. What remains is the question that actually matters: what does your care coordination look like when your platform is finally working as hard as your team is?