
If your work involves coordinating care in New York, you already know that reporting isn’t just another task on the checklist. It has slowly become one of the biggest forces shaping how teams document care, track outcomes, and make day-to-day decisions. The challenge isn’t that the state lacks data or structure. It’s that behavioral health reporting in New York is built on layers of programs, portals, and evolving regulations that rarely speak the same language.
A single patient might appear in PSYCKES for quality indicators, in MAPP for Health Home enrollment, in SHIN-NY for clinical events, and across multiple MCO portals for plan-level reporting. Each system tells a slightly different story, and coordinators are expected to stitch those stories together while still managing outreach, crisis triage, and care-plan follow-through. Studies from New York’s integrated care initiatives show that smaller behavioral health agencies often lack the analytics capacity to keep up with these fragmented workflows, which leads to delays, inconsistent reporting, and gaps in population-level insights.
Understanding New York’s reporting breakdown points
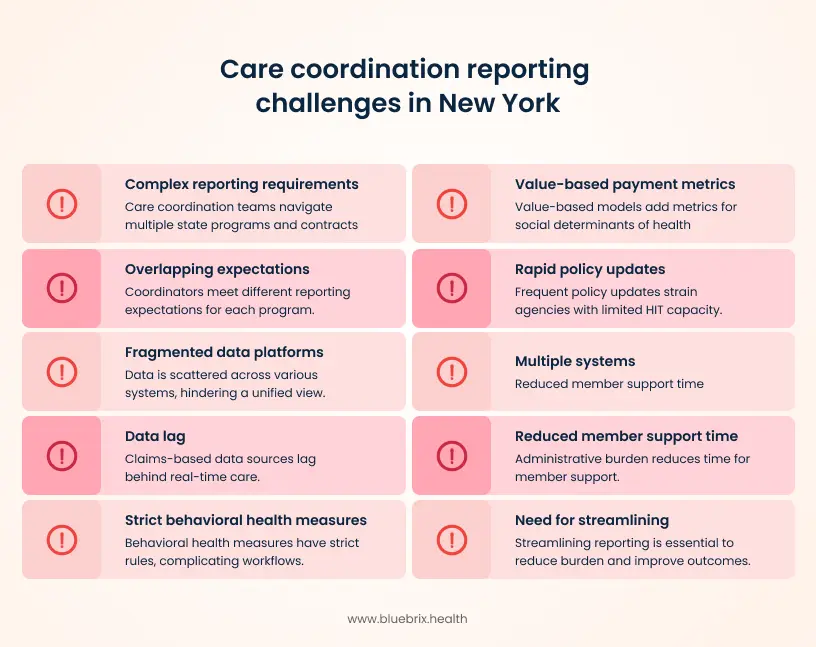
Fragmentation shows up in real operational pressure points. One New York network with over a dozen downstream partners recently discovered that their QARR follow-up rates looked different in every system they pulled data from. Claims in PSYCKES were three weeks behind real-time outreach, the EHR captured telehealth flags inconsistently, and Health Home notes used narrative fields that couldn’t be rolled up into performance dashboards. The result was predictable: coordinators spent more time reconciling systems than connecting members to care.
And as measure specifications change, especially with DOH, OMH, and OASAS updates landing several times a year, teams end up reacting rather than adapting. That’s where the real cost appears. Every hour spent untangling conflicting data sources is an hour not spent supporting someone moving through a psychiatric discharge, navigating housing instability, or trying to stay engaged in outpatient treatment.
The good news is that this complexity can be managed. When care coordination workflows are intentionally aligned with how New York defines, measures, and exchanges behavioral health data, reporting becomes far more predictable and significantly less time-co
What actually causes reporting to break down across New York’s behavioral health network?
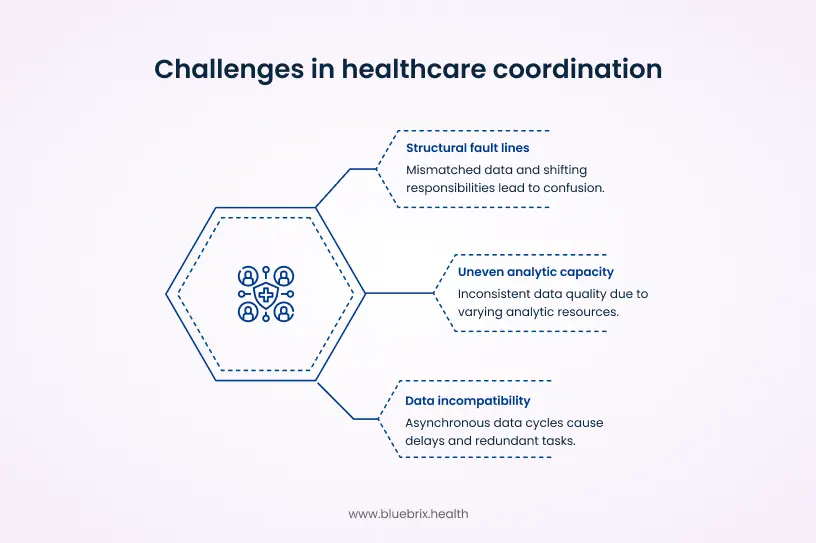
New York’s reporting challenges aren’t just the result of many portals or strict measures. Those are symptoms. The root issue is that the state’s behavioral health infrastructure was never built to function as a unified reporting ecosystem. Instead, every program, plan, and agency evolved its own data conventions, its own timelines, and its own definitions of success. Care coordination teams sit in the middle of all of this, expected to reconcile systems that were never designed to work together.
At the structural level, responsibility is distributed across DOH, OMH, OASAS, MCOs, Health Homes, BH IPAs, and downstream CMAs. Each entity touches the same member, yet no single organization owns the “whole picture” of that person’s journey. This creates the first fault line. When attribution shifts between plans, or when program enrollment is updated in one system but not another, coordinators are left navigating mismatched lists, outdated panel assignments, and reporting gaps that appear through no operational failure of their own.
A second pressure point emerges from incompatible data cycles. For example, PSYCKES refreshes Medicaid claims on a lag, HIE alerts fire in real time, and Health Home documentation updates only when agencies submit notes. These asynchronous data clocks make it almost impossible to build a consistent population registry. A coordinator might confirm a discharge today, only to find that the claims-based alert for that same discharge arrives three weeks later and triggers tasks that have already been completed. Multiply this across thousands of members, and the operational friction becomes immense.
A third, less visible but equally important cause lies in uneven analytic capacity across agencies. Larger systems may have teams dedicated to mapping QARR fields, scrubbing encounter files, or translating MEDS II error codes into corrective workflows. Smaller community providers often don’t, which means data enters the network with inconsistent coding, documentation gaps, or missing structured fields. Once that data travels downstream to plans or the state, those inconsistencies become performance discrepancies that coordinators must manually explain after the fact.
A local example illustrates this well. A mid-Hudson IPA discovered that nearly 18 percent of encounters from smaller CMAs failed to match in MEDS II submissions, not due to incorrect care but due to missing modifiers or inconsistent place-of-service codes. Plans rejected the encounters. Coordinators were then tasked with reconstructing what happened weeks later, even though they had handled the actual care event correctly. The reporting failure wasn’t operational. It was architectural.
Finally, the pace of regulatory change compounds the instability. New templates, new QARR definitions, updated SHIN-NY policies, and shifting VBP requirements can outpace agencies’ ability to modify workflows. When guidance updates reach coordinators months late, data capture falls out of sync with current rules, creating avoidable reporting discrepancies that look like quality gaps but are really timing gaps.
These structural forces form the foundation of why reporting “breaks” in New York. They are not simply workflow issues. They are systemic design constraints that demand a coordinated, statewide approach to data alignment. The strategies that follow are shaped with that reality in mind.
Strategy 1: Align care coordination workflows with New York’s BH QARR measures
One of the most effective ways to reduce reporting friction in New York is to rebuild care coordination workflows around the behavioral health measures that plans and the state actually use. QARR pulls heavily from HEDIS but adds New York specific nuances that influence day-to-day coordination far more than most teams realize. The 2025 updates reinforce this, especially with the new Social Need Screening (SNS-E) measure, which requires structured capture of housing, food security, transportation, and other social drivers. If that information sits in free-text fields, plans cannot count it, and organizations risk losing QARR-linked revenue.
When tasks, documentation fields, and handoff steps are shaped around these measures, reporting begins to stabilize and outcomes naturally improve because the operational work mirrors the structure of the metrics.
Take the follow-up after hospitalization for mental illness measure. Many teams already conduct outreach within 7 and 30 days, but the documentation rarely captures every detail QARR requires. Coordinators often record the contact in narrative form, miss service codes, or omit telehealth flags. These small gaps become major reporting losses. When teams redesign their workflows so that each post-discharge call triggers a structured task that captures date, encounter type, diagnosis confirmation, scheduling status, social need screening status, and linkage to services, the reporting line becomes clean and auditable.
Embedding QARR logic directly into tools makes the alignment stronger. One New York network with a large HARP population implemented auto-generated tasks for coordinators whenever a SHIN-NY alert indicated a behavioral health admission. The task list was mapped to QARR requirements: confirm discharge, schedule aftercare, document outreach attempts, record telehealth use, verify medication follow-up, and complete SNS-E fields if social needs emerged during transition. Within four months, their reported follow-up rates rose by more than 12 percentage points, not because the care quality changed but because the data finally reflected the work being done.
This level of alignment also helps teams anticipate reporting needs rather than react to them. For example, antipsychotic metabolic monitoring requires tracking labs that coordinators do not order themselves but can coordinate with primary care providers. When workflows include structured fields to record outreach to PCPs, lab checks, SNS-E follow-up, and member reminders, QARR abstraction improves without adding new systems or staff. The intent is to ensure these touches translate into abstraction-ready fields rather than clinical notes that never reach QARR.
Training plays a critical role. Coordinators need to understand not just what QARR measures are, but how their actions materially affect performance. When supervisors walk through real cases comparing how a visit appears in the system versus how it counts in QARR, coordinators see the direct link between documentation decisions and reported quality. This reduces the familiarity frustration of doing the work but having it disappear in reports.
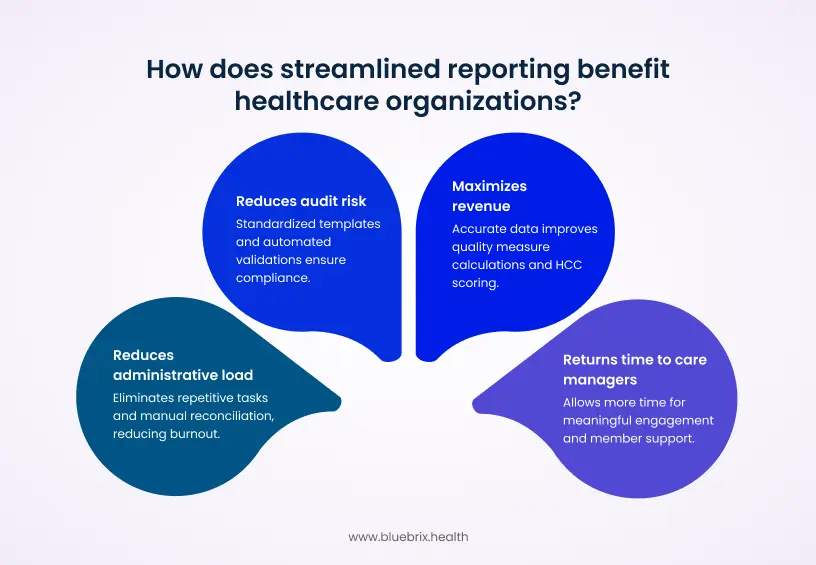
Embedding QARR principles into coordination workflows reframes reporting from a compliance burden to an operational advantage. With clearer structure and cleaner data capture, reporting stabilizes and care teams can redirect energy to timely outreach, social need support, and engagement instead of reconciling system inconsistencies.
Strategy 2: Strengthen care coordinator-led encounter data reconciliation for MEDS II
Once workflows are aligned with QARR requirements, the next bottleneck usually appears in a very different place: encounter data. Even when coordinators document care correctly, New York’s MEDS II process often becomes the point where reporting breaks down. Plans submit behavioral health encounters to the state, MEDS II validates them, and anything that doesn’t meet strict formatting or coding rules is rejected. The issue is that coordinators are often closest to the real sequence of care, but farthest from the formal encounter submission process.
Treating encounter reconciliation as a shared responsibility solves that gap. When analytics teams translate MEDS II error codes into clear, coordinator-friendly worklists, coordinators can verify what actually happened: Was a visit rescheduled? Was a diagnosis updated after the encounter? Did the provider forget to add a telehealth modifier? These corrections, when made upstream in the care management platform or EHR, prevent repeat rejections and improve the accuracy of downstream reporting like QARR, PSYCKES indicators, and VBP performance files.
A New York Health Home serving roughly 10,000 members offers a clear illustration. They discovered that nearly one in five behavioral health encounters submitted by downstream CMAs failed to match in MEDS II. The root problem wasn’t care delivery. It was inconsistent coding of place-of-service and missing telehealth flags during hybrid visits. After implementing a coordinator-led validation loop, the network reduced mismatched encounters by more than 30 percent in one quarter. For the coordinators, the shift was subtle but meaningful: their local understanding of member interactions directly strengthened plan-level submissions. The value is reporting stability, because corrected encounters feed QARR, VBP, and risk files accurately.
This model works especially well when networks build simple but structured reconciliation routines. For example:
- Weekly MEDS II exception lists converted into coordinator review tasks
- Standard correction pathways for common errors like missing modifiers or diagnosis codes
- Shared responsibility agreements with clinics to fix documentation upstream
- Automated alerts when high-impact encounters (such as post-discharge visits) fail MEDS II validation
By making coordinators part of the encounter quality pipeline, networks move from passive recipients of rejected files to active partners in improving data completeness. And because QARR, VBP reporting, risk scoring, and even PSYCKES metrics depend on clean encounters, the payoff extends far beyond compliance. It creates a stable data foundation for every other reporting workflow that follows by stabilizing the reporting outputs plans rely on.
Strategy 3: Standardize behavioral health documentation and care plan templates across coordinators and partner agencies
Once encounter data begins to stabilize through clearer reconciliation, the next major source of reporting friction usually comes from documentation variability. New York’s behavioral health ecosystem is built on partnerships: CMAs, OMH clinics, HCBS providers, ACT teams, hospital systems, and Health Home leads often document in entirely different ways. Even within a single network, note formats, problem lists, and care plan structures can vary enough to make aggregation nearly impossible.
Standardizing documentation is not about limiting clinical judgment. It’s about creating a reliable spine of structured fields that support both care and reporting. When coordinators record core elements such as diagnoses, risk factors, SDOH domains, intervention types, and follow-up actions in consistent formats, the data can move cleanly across systems, whether it’s feeding QARR abstraction, PSYCKES indicators, plan dashboards, or internal audit trails.
Assume a multi-location Health Home coalition that confronted this issue when preparing quarterly performance reports. They discovered that although all partner agencies documented care plans, each used different goal frameworks, intervention categories, and follow-up fields. As a result, the coalition spent weeks mapping dozens of note types into a single reporting format. The real impact wasn’t the extra analyst time. It was the distortion of performance data. What looked like inconsistent care delivery was actually inconsistent documentation.
To fix this, the coalition created a unified “BH coordination documentation spine.” It included:
- A shared assessment structure covering behavioral health diagnoses, co-occurring conditions, risk scores, and SDOH
- A standardized care plan with consistent problem statements, goals, interventions, and status updates
- Encounter note templates that captured QARR-relevant fields like service type, modality, and follow-up timelines
- A mapping document that downstream partners integrated into their local EHRs or care management tools
Within two reporting cycles, the coalition’s data completeness improved enough that plan p5artners began relying more on Health Home structured data rather than manual chart review. Standardization also supports clinical collaboration. When ACT teams, outpatient providers, and coordinators all use the same care plan structure, handoffs become smoother. Everyone sees not just the narrative of the member’s challenges but the structured indicators that connect directly to state and plan measure definitions. The point is not collaboration alone, but ensuring those elements can roll into QARR, PSYCKES, audit trails, and plan dashboards.
By reducing variation in how care is documented, networks eliminate one of the biggest hidden causes of reporting noise. What emerges instead is a consistent, comparable set of behavioral health data that strengthens care management and simplifies every downstream reporting requirement rather than just improving teamwork culture.
Strategy 4: Integrate behavioral health providers into SHIN-NY and QE data workflows
As documentation becomes more standardized, the next barrier is data completeness. Even the best care coordination workflows cannot perform well if coordinators are working with partial or outdated information. In New York, that gap often comes from inconsistent SHIN-NY participation across behavioral health agencies. Hospitals and FQHCs are typically well connected to their regional QEs, but many OMH clinics, OASAS programs, HCBS providers, crisis teams, and residential programs either lack full integration or use the data only sporadically.
This uneven connectivity means coordinators often learn about critical events like inpatient admissions, ED visits, discharge summaries, and medication changes long after they occur. By the time data shows up in PSYCKES or on a claims feed, the window for timely outreach has already passed, which directly affects measures like follow-up after hospitalization and continuity of care.
Building QE integration into the coordination model closes this gap. When behavioral health agencies actively participate in SHIN-NY, coordinators gain near real-time visibility into member activity. Event notifications trigger immediate outreach. Updated clinical summaries flow into care plans without waiting for claims. And coordinators stop relying on manual phone calls to verify transitions.
A clear example comes from a Central New York network that onboarded its outpatient behavioral health providers to their regional QE. Before integration, coordinators were missing nearly half of psychiatric discharges in real time, which meant many members were not contacted until days or weeks later. After enabling HIE alerts and embedding consent collection into enrollment workflows, the network saw a measurable shift:
- 40 percent reduction in missed discharge alerts
- More consistent 7-day follow-up documentation
- Fewer duplicate outreach attempts because coordinators could see real-time status in the QE feed
The improvement wasn’t just operational. The network’s QARR follow-up rates increased because outreach aligned more closely with when care events occurred, not when claims eventually updated.
To make QE participation sustainable, networks often create SHIN-NY integration playbooks that outline:
- How and when agencies should connect
- Roles for coordinators in reviewing and documenting QE alerts
- Standardized workflows for importing C-CDA or CCD summaries
- Governance practices for consent, data use, and privacy compliance
This creates a stable ecosystem where all behavioral health partners contribute to and benefit from shared data.
New York’s 1115 waiver adds another layer. Social Care Networks are responsible for routing referrals, status updates, and outcomes between community-based organizations and the state. That model requires a data platform that can serve as the traffic controller for these exchanges. blueBriX fills that role by connecting SHIN-NY event data, CBO handoffs, and structured reporting outputs so SCNs can meet state expectations. This routing is what enables DOH-facing closure, status, and encounter reporting.
Integration with SHIN-NY is more than a technical upgrade. It is a structural shift that allows coordinators to act on complete, current information and ensures that reporting reflects real member activity rather than delayed or fragmented signals. With this foundation, follow-up metrics, audit readiness, and care plan accuracy all improve without adding more administrative burden.
Strategy 5: Build audit-ready workflows that support coordinators’ documentation responsibilities
As SHIN-NY integration improves data completeness, the next challenge is ensuring that documentation holds up when auditors review it. New York’s Health Homes, OMH and OASAS programs, and Medicaid managed care contracts all expect that every coordination activity can be traced, verified, and matched to the member, service type, and timeline. When organizations treat audit preparation as a periodic clean-up project, documentation gaps accumulate, and coordinators end up revisiting months-old encounters under significant time pressure.
Audit-ready workflows shift documentation quality from a retrospective task to an operational norm. Instead of relying on after-the-fact corrections, teams build structured templates, enforce required fields, and apply automated checks at the point of documentation. Supervisors then review small samples continuously, not to micromanage coordinators but to tune workflows, address recurring issues, and ensure the data powering reports reflects what auditors will later request.
This approach reflects what New York oversight bodies have repeatedly surfaced. OMH and DOH audit summaries often cite the same trends across behavioral health programs: missing consents, incomplete encounter notes, inconsistent problem lists, and documentation elements that do not align with billing or quality specifications. These findings rarely signal poor care delivery. Instead, they point to fragmented workflows and the lack of standardized templates across partner agencies. Programs that shifted to structured, audit-ready documentation models reported fewer corrective actions and a more consistent alignment between documentation and reporting requirements.
A strong audit-ready workflow typically includes:
- Minimum documentation standards embedded directly into note and care plan templates
- Hard-stop validations that prevent closure of visits missing required elements
- Time-stamped action logs tied to enrollment, outreach, and follow-up cycles
- Clear audit trails that link each documented action to billing, QARR, and compliance requirements
- Routine micro-audits that inform training and template updates
- Standardized correction processes aligned with OMH, DOH, and MCO expectations
These workflows protect coordinators as much as they protect the organization. Audit readiness is ultimately about creating a stable reporting backbone. When the same data used for internal dashboards, QARR submissions, plan reporting, and state audits all originate from a clean, structured workflow, every downstream process becomes easier and more predictable, allowing coordinators to focus more of their time on member care instead of administrative backtracking.
Strategy 6: Develop MLTC and MAP reporting routines that reflect coordinators’ roles in service tracking and reassessments
After strengthening audit readiness, the next layer of reporting complexity emerges in MLTC and MAP programs. These plans depend on accurate assessments, timely reassessments, care plan updates, personal care service utilization tracking, and detailed documentation of changes in member needs. While these activities are led by plan teams, care coordinators often play a quiet but essential role for members with behavioral health needs, especially those who struggle with appointment adherence, functional changes, or transitions between settings.
The problem is that coordinators’ contributions rarely appear in the files plans submit to DOH. MLTC/MAP reporting structures rely heavily on Uniform Assessment data, claims, and plan-level documentation. If coordinator-driven tasks such as confirming home care hours, supporting transportation arrangements, identifying changes in ADLs, or flagging new safety concerns stay buried in free-text notes or local workflows, the reporting picture becomes incomplete. Plans lose visibility into the behavioral drivers behind service changes, and coordinators lose the opportunity to influence how care patterns are interpreted at the plan and state level.
A Bronx-based MAP plan confronted this issue when reconciling reassessment timelines for a cohort of high-need members. Coordinators were consistently helping members complete pre-assessment preparation and post-hospitalization reassessment steps, but none of this activity was captured in structured fields. As a result, the plan’s reporting files could not fully explain why certain reassessments occurred earlier than scheduled or why personal care hours fluctuated. Once the plan and its care management partners created structured “MAP touchpoint fields” covering outreach attempts, member readiness checks, home care hour verification, and hospitalization follow-up, the reporting accuracy is improved, and reassessment delays are dropped.
The reimbursement environment adds new urgency. New York’s waiver allows billing for health-related social needs such as housing and nutrition. That requires a way to track these billable events rather than treating them as informal coordination tasks. If coordinators cannot document structured housing, food, or transportation support, plans miss legitimate revenue opportunities and the state sees an incomplete care picture. And the reporting output fails to reflect reimbursable social-need activity.
Effective MLTC/MAP alignment usually involves three steps:
- Identifying coordination touchpoints that influence plan submissions, such as pre-assessment outreach, missed home care shifts, functional decline alerts, or post-discharge follow-up
- Embedding structured fields into the care management system to capture these touchpoints in formats that can map directly to plan-level reporting categories
- Creating joint reporting routines where plans and coordination teams review key variances together, ensuring that behavioral health factors are properly represented in DOH submissions
This joint model reduces the disconnect between what coordinators observe on the ground and what plans must justify in formal reports. It also helps plans contextualize utilization patterns for high-risk members, particularly those who cycle between hospitalization, home care, crisis services, and community supports.
By formalizing the coordinator’s role in MLTC/MAP data capture, networks create a more transparent picture of member needs. Reporting becomes less reliant on claims alone and more reflective of the real-life support required to keep members safe, stable, and connected to both behavioral health and long-term care services.
Strategy 7: Create a rapid-update process to help coordinators adapt quickly to DOH, OMH, and OASAS changes
Once MLTC and MAP reporting routines are in place, the final barrier to consistent reporting performance is the pace of regulatory change. New York’s behavioral health and care management landscape evolves constantly. QARR specifications shift, SHIN-NY rules update, Medicaid VBP guidance is revised, and OMH or OASAS programs introduce new documentation or billing expectations. These updates often land simultaneously across agencies, and without a structured process, they take months to reach front-line coordinators.
That delay has measurable consequences. When templates, care plans, and workflows lag behind updated specifications, coordinators may unknowingly document in formats the state no longer recognizes. A change in a QARR measure definition, a new SHIN-NY consent requirement, or a revised encounter field can create hundreds of reporting discrepancies simply because teams were not informed in time. These gaps then surface during audits, quality reviews, or plan submissions, often requiring extensive retroactive correction.
A rapid-update process helps prevent this drift. Instead of distributing policy updates through sporadic emails or long PDF memos which coordinators rarely have time to parse organizations treat regulatory changes like product releases. A cross-functional group reviews new guidance, identifies which documentation fields or workflows are affected, updates templates and dashboards, and schedules short coaching sessions for coordinators. This ensures that the operational changes reach the people entering the data before inconsistencies appear in reports.
Imagine one network in Western New York created a “change review squad” with clinical, quality, IT, and operations leads. Whenever DOH or OMH released an update, the team will use a simple impact template:
- Which QARR, Medicaid, or SHIN-NY measures are affected?
- Which documentation fields need adjustment?
- Which coordinator workflows must change?
- Which reports, dashboards, or exports need updates?
- What training or communication is required?
By time-boxing these updates, the network prevented months-long delays between policy changes and workflow adoption. Coordinators received brief micro-learning sessions embedded into supervision, helping them understand not only what changed, but why it mattered for reporting accuracy.
A rapid-update process doesn’t eliminate regulatory churn, but it reduces the operational friction it creates. It ensures that coordinators document using the current definitions, that reports reflect the latest specifications, and that the organization stays aligned with state expectations without relying on last-minute corrections.
With this final strategy, the reporting ecosystem becomes stable enough for teams to focus on meaningful coordination work instead of constantly adjusting to outdated templates or unclear instructions.
How aligned coordination workflows improve behavioral health outcomes and reporting accuracy?
When care coordination workflows are intentionally aligned with how New York measures and exchanges behavioral health data, teams begin to see improvements that extend well beyond cleaner reports. The alignment creates a feedback loop where the same actions that support member stability also generate the structured information plans and state agencies rely on. Over time, this reduces discrepancies between what coordinators know is happening and what appears in QARR, PSYCKES-like indicators, Medicaid submissions, or internal dashboards.
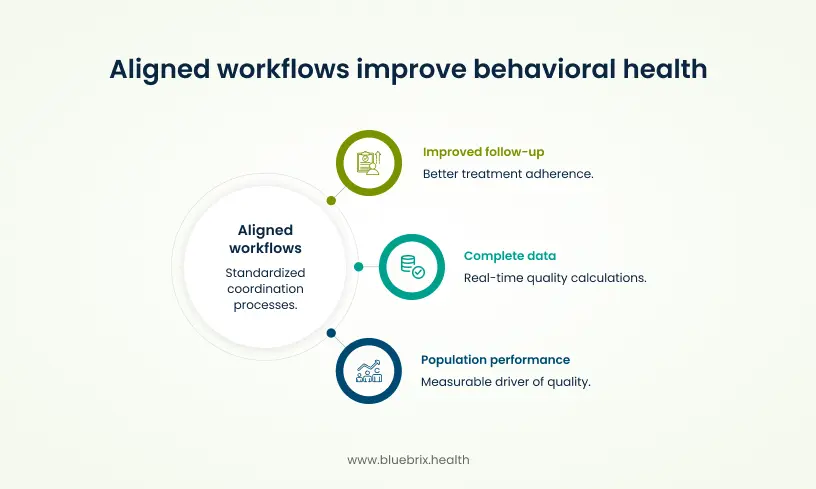
One of the most visible gains is improved follow-up for high-risk members. Evidence from New York’s Health Home model shows that adults with significant behavioral health needs experience better treatment adherence and lower inpatient utilization when coordination is standardized around shared metrics. For example, workflows that embed outreach tasks for 7- and 30-day post-discharge follow-up not only satisfy QARR requirements but also reduce the likelihood of rapid readmissions or crisis-driven ED use. These outcomes align with state regulations requiring hospitals to coordinate discharge planning with care managers, reinforcing the link between coordination workflows and long-term stability.
Aligned workflows also generate more complete, timely data. When coordinators document service types, dates, modalities, and diagnoses in structured fields that match QARR or Medicaid encounter expectations, plans can rely less on retrospective chart review and more on real-time data for quality calculations. Integrating SHIN-NY alerts and consolidated clinical histories into coordination systems strengthens this further. Studies in New York have associated statewide HIE use with measurable reductions in readmissions, ED visits, and unnecessary spending, driven in part by better information flow between care teams.
A third benefit is the ability to connect individual coordination activity to population-level performance. As data becomes more consistent, networks can stratify members by risk, track outcomes across specific programs like HARPs or Health Homes, and identify where care transitions or documentation are breaking down. This visibility transforms coordination from a narrative, person-by-person effort into a measurable driver of quality. For programs serving people with co-occurring medical and behavioral health needs, this shift supports more consistent outpatient engagement, better chronic disease management, and improved self-reported health outcomes.
These improvements matter because they create convergence between how care is delivered and how success is measured. Coordinators no longer experience the frustration of doing the work only to see it missing from dashboards or plan reports. Leaders gain clearer insight into performance drivers. Plans and agencies get cleaner data. And members receive more reliable, structured support during moments when continuity of care matters most.