

Most behavioral health clinics already know they should be tracking performance data. The harder question is which numbers actually move the needle and whether the data being collected aligns with what payers, regulators, and accreditation bodies are now measuring. The shift to value-based care has fundamentally changed the stakes. Under fee-for-service, a clinic’s financial health depended primarily on volume. Under value-based arrangements, which now govern a growing share of Medicaid, CCBHC, and managed care contracts, reimbursement is increasingly tied to outcomes, quality metrics, and operational efficiency. That means the KPIs a clinic tracks are no longer just internal management tools. They are the evidence base that determines how much a clinic gets paid.
For the purposes of this article, we will focus specifically on behavioral health clinics. Behavioral health clinics, whether they are Certified Community Behavioral Health Clinics (CCBHCs), Community Health Mental Centers (CHMCs), outpatient clinics, virtual clinics, clinics for individuals with intellectual and developmental disabilities (IDDs), or substance use disorder (SUD) treatment centers, need to track key performance indicators (KPIs) to ensure they provide high-quality care and operate efficiently.
Why these metrics matter more in 2026
Three policy developments in the past 18 months have made behavioral health KPI tracking a compliance and reimbursement issue, not just an operations one.
CCBHC expansion
The Consolidated Appropriations Act of 2024 (CAA, 2024), signed into law on March 9, 2024, made the CCBHC programme a permanent optional Medicaid state plan benefit. In June 2024, HHS added ten new states to the CCBHC Medicaid demonstration programme, bringing the total number of participating states to 20. CCBHCs operating under the 2023 updated certification criteria (mandatory for most clinics from July 1, 2024) are required to collect and report on a defined set of quality measures beginning calendar year 2025. Several of the metrics covered in this article, including follow-up rates after hospitalisation, readmission rates, and client wait times, are directly referenced in the SAMHSA CCBHC quality measure set. (Source: CMS, Certified Community Behavioral Health Clinic Demonstration, 2024; SAMHSA, CCBHC Quality Measures Guidance, 2024.)
MHPAEA parity and documentation
The 2024 MHPAEA Final Rule, published September 9, 2024 and effective November 22, 2024, required health plans to conduct and document comparative analyses of nonquantitative treatment limitations for mental health and substance use disorder benefits. Although enforcement of the 2024 Final Rule’s new provisions was paused by the current administration on May 15, 2025, the underlying 2013 MHPAEA statutory obligations and the CAA, 2021 comparative analysis requirements remain in force. For clinics, this means that data demonstrating parity in access, wait times, and service delivery continues to be relevant to payer negotiations and audit defence. (Source: U.S. Departments of Labor, HHS, and Treasury, MHPAEA Non-Enforcement Statement, May 15, 2025.)
Mandatory Medicaid behavioural health quality reporting
Beginning with 2024 data, reporting of all Child Core Set measures and the behavioural health measures on the Adult Core Set became mandatory for states. Clinics operating within Medicaid managed care and CCBHC frameworks need to understand which of their operational KPIs feed into state-reported quality measures and ensure their EHR or analytics platform can extract that data on demand. (Source: CMS, 2024 Mandatory Core Set of Behavioral Health Measures for Medicaid and CHIP.)
Here are ten important metrics that every behavioral health clinic should consider, to optimize their revenue:
1. Client load or caseload
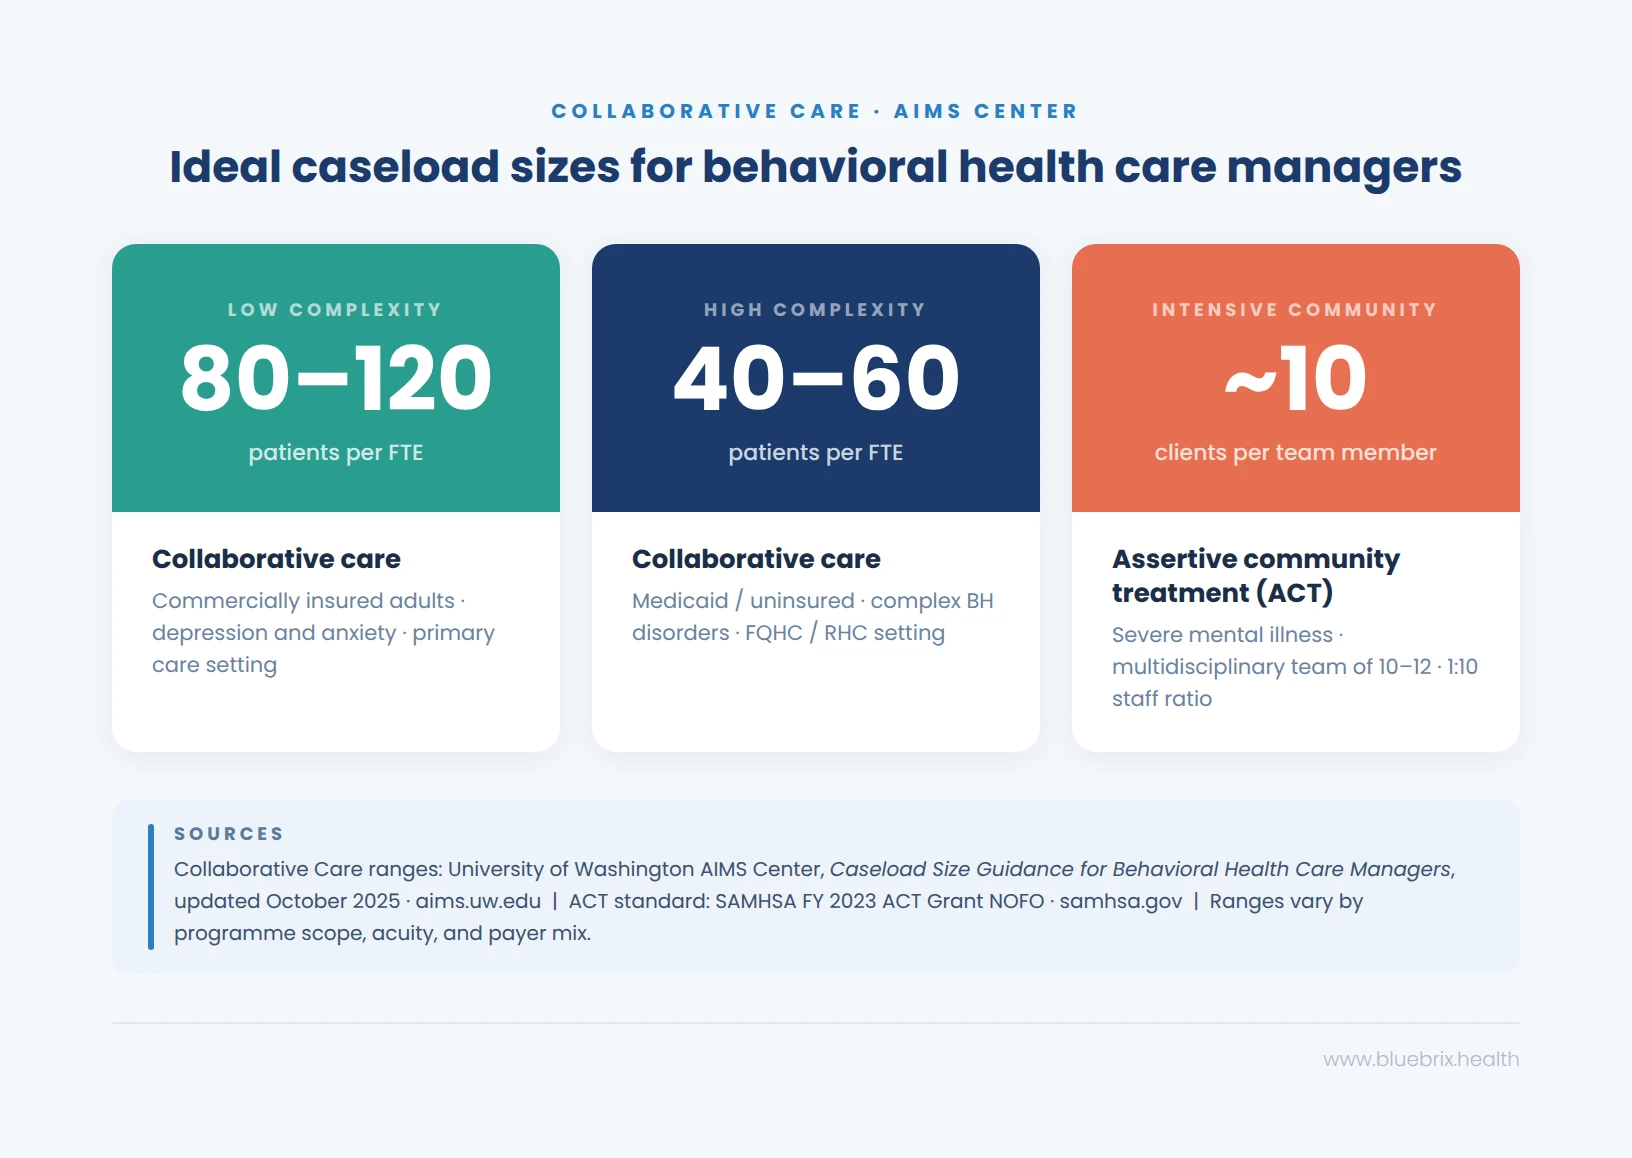
Effectively managing the number of clients each provider oversees—referred to as “caseload”—is crucial in behavioral health for delivering quality care and ensuring positive outcomes. A manageable caseload allows providers to dedicate adequate time and attention to each client, reducing the risk of burnout and enhancing client satisfaction.
In behavioral health, caseloads are typically measured by the number of clients a provider is responsible for at any given time. However, the complexity of each case significantly influences the ideal caseload size. For instance, intensive case management models, such as Assertive Community Treatment (ACT), often involve smaller caseloads due to the high needs of the clients they serve. ACT teams, comprising 10–12 multidisciplinary professionals, share caseloads to provide continuous, comprehensive care. Factors such as appointment length, client complexity, support systems and service delivery model influence caseload size.
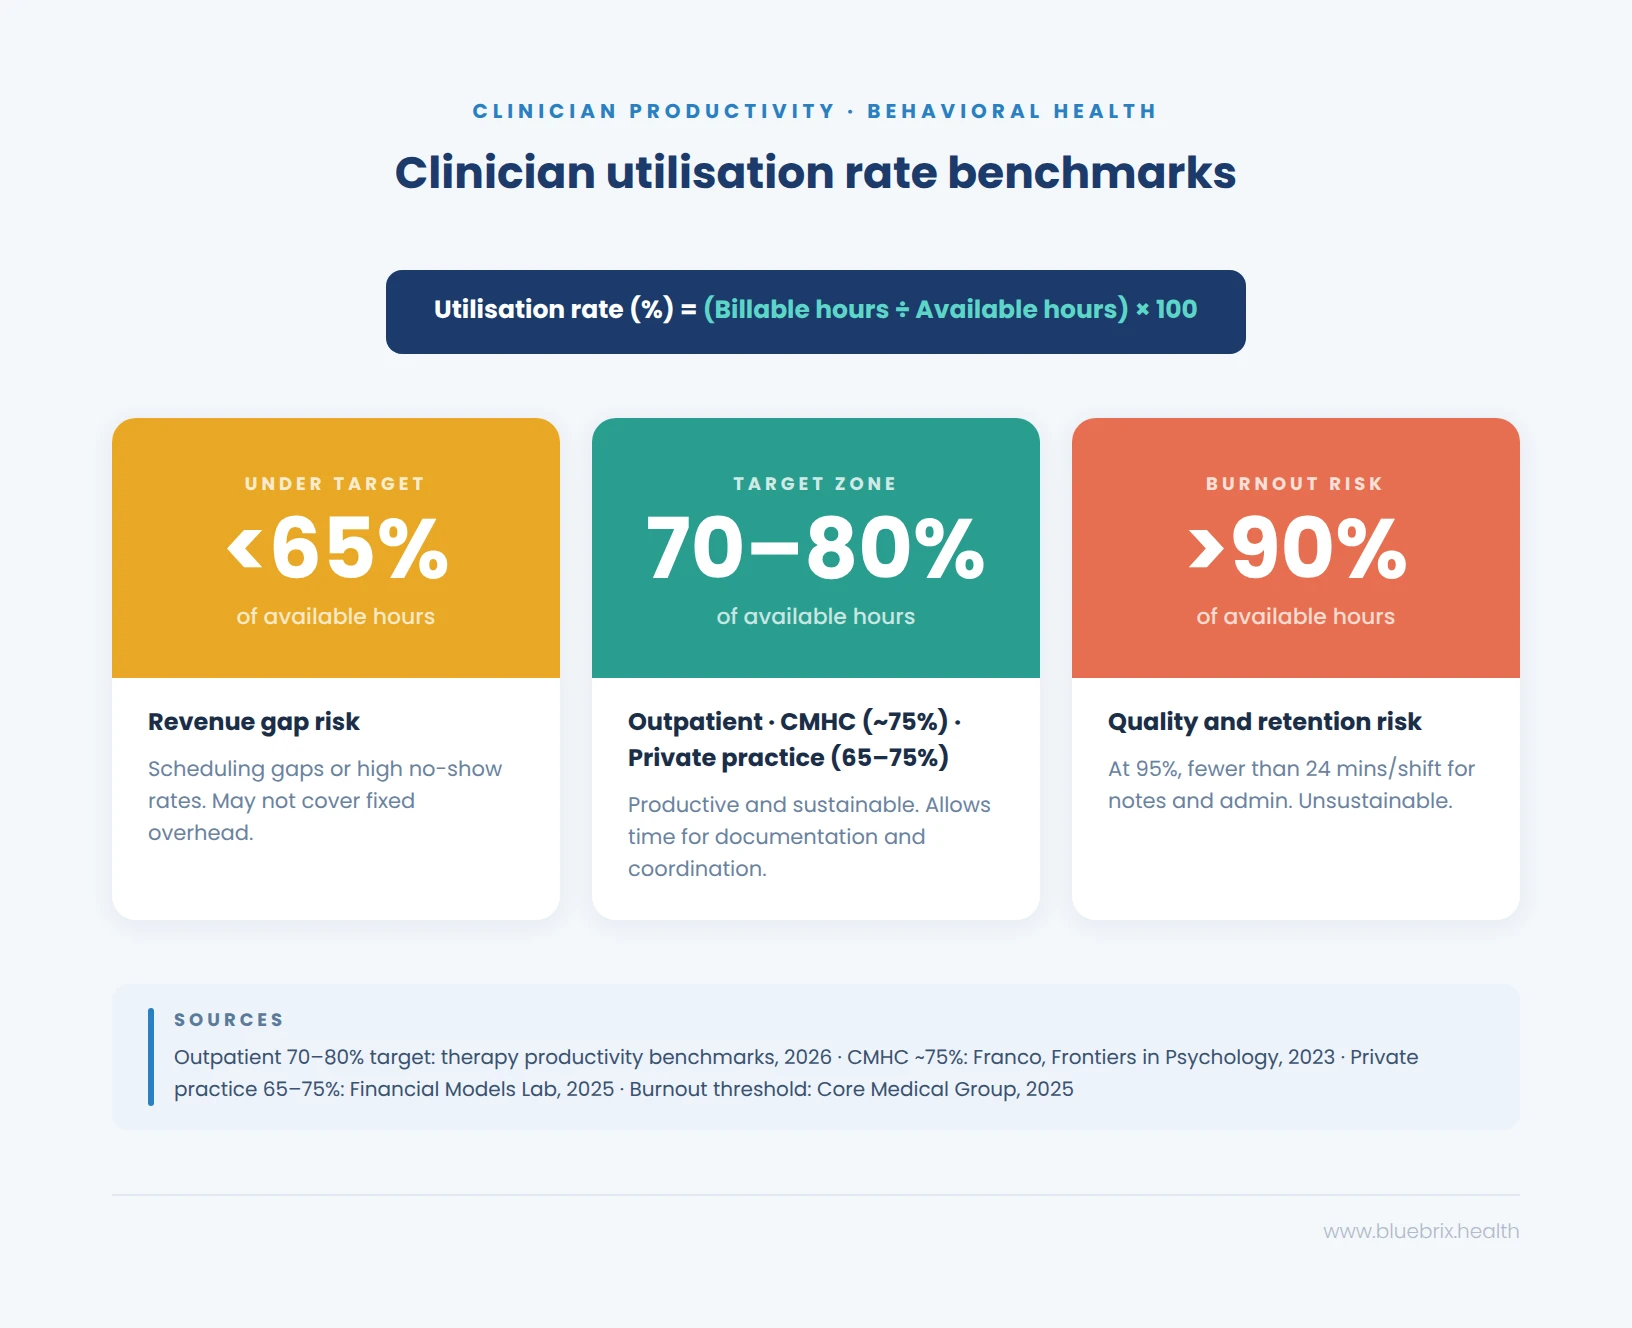
2. Appointments per clinician
Appointment per clinician is a key performance indicator (KPI) used in behavioral health to measure the productivity of clinicians. It tracks the number of appointments each clinician conducts over a specific period, such as daily, weekly, or monthly. This metric helps in understanding workload distribution, identifying potential burnout, and optimizing clinician schedules. It is calculated as follows:
Appointments per clinician = total number of appointments/number of clinicians
Note that appointment volume is only one dimension of clinician productivity. Under value-based care arrangements, clinics increasingly need to balance throughput against documentation quality, outcome capture, and care coordination tasks — all of which require time that does not appear in appointment counts alone.
3. No-show and cancellation rates
No-show gauges the percentage of scheduled appointments that were missed and cancellation rate represents the percentage of appointments cancelled by patients. Missed or cancelled appointments are problematic for practices because they lead to no revenue or partial revenue. Gaining insight into this information allows your practice to implement procedures to reduce the percentage of no-shows and cancellations. For example, implementing a text reminder system can be beneficial to reduce these rates. Behavioral health treatment appointments are often scheduled weeks or months apart, making it understandable why a patient might forget them. By sending an automated text reminder 72 hours before the appointment, you can ensure that the patient remembers their appointment and will be able to take the necessary steps to attend their scheduled appointment.
No-show rate = (total number of no-show appointments / number of scheduled appointments) ×100
Cancellation rate = (total number of cancelled appointments / number of scheduled appointments) ×100
No-show rates vary considerably across behavioral health settings. Peer-reviewed literature reports rates ranging from 20% to 30% in outpatient therapy, with psychiatry averaging approximately 23% and SUD treatment programmes sometimes reaching 30% to 50%. Community mental health clinics consistently report higher rates than other healthcare settings.
No-show and cancellation rate benchmarks
| Setting | Industry average | Improvement target |
|---|---|---|
| Outpatient therapy | 20–30% | Below 15% |
| Psychiatry | ~23% | Below 15% |
| SUD treatment (outpatient / IOP) | 30–50% | Below 20% |
| Community mental health (CMHC / CCBHC) | 25–35% | Below 20% |
Source: Ghaddaripouri & Eslami, Health Science Reports, 2024. https://doi.org/10.1002/hsr2.2160. Improvement targets reflect feasible goals based on published intervention outcomes.
4. Revenue and reimbursement
Revenue in behavioral health refers to the total income generated from providing mental health and substance use disorder services. Reimbursement Rates are the amounts that healthcare providers receive from insurance companies, Medicare, Medicaid, or other payers for the services they deliver. These metrics are crucial because they ensure that your billing process is running effectively and efficiently, allowing you to operate seamlessly without financial difficulties.
Reimbursement rates in behavioral health vary significantly by payer, state, contract type, and level of care. Medicare rates are set annually through the CMS Physician Fee Schedule — effective January 1 each year — while Medicaid rates are determined at the state level and differ across fee-for-service, managed care, and CCBHC prospective payment structures. Private payer rates are negotiated individually and are not publicly published.
The most reliable reference point for your clinic is the current CMS Physician Fee Schedule, available at cms.gov/medicare/physician-fee-schedule, alongside your state Medicaid agency’s published fee schedule. For CCBHCs, the prospective payment system rate is set by your state and updated periodically — your state Medicaid agency is the authoritative source.
What matters operationally is not the published rate in isolation, but whether your clinic is consistently collecting at or near that rate across all payer types. Tracking expected reimbursement against actual collections — by payer, CPT code group, and programme — is where revenue leakage becomes visible. blueBriX can be configured during implementation to surface this comparison in real time, flagging the payer contracts and service lines where collections are falling short of contracted rates.
5. Revenue cycle performance metrics
A clinic can have strong reimbursement rates and still haemorrhage revenue if the underlying billing cycle is inefficient. Revenue cycle performance metrics measure whether the money owed is actually being collected — and how quickly. Three indicators tell this story most clearly.
Days in accounts receivable (days in AR)
Days in AR measures how long it takes, on average, to collect payment after a claim is submitted.
Days in AR = Total AR balance ÷ Average daily charges
The target for a well-functioning behavioral health revenue cycle is under 45 days. The industry average for behavioral health practices reached 65–75 days in 2025, up from 50–55 days in 2024 — driven by growing prior authorisation complexity and increased payer scrutiny of documentation. Any figure above 60 days warrants a segmented review by payer type and level of care. Residential and PHP settings typically drive the largest deviations. Days in AR is a lagging indicator — it reflects problems that began weeks earlier, which is why weekly tracking by payer segment catches deterioration before it becomes a cash flow crisis.
Clean claim rate
Clean claim rate is the percentage of claims accepted by the payer on first submission without errors, omissions, or missing information.
Clean claim rate (%) = (Claims accepted without edits ÷ Total claims submitted) × 100
The industry benchmark for behavioral health is 92–95%. Top-performing practices reach 98–99%. A clean claim rate below 92% means your billing team is spending significant time on rework that should not exist — and every rework cycle delays cash flow and risks missing appeal windows.
Denial rate
Denial rate is the percentage of submitted claims rejected by the payer after processing.
Denial rate (%) = (Total denied claims ÷ Total submitted claims) × 100
For SUD and mental health facilities, a total initial denial rate of 5–10% is considered acceptable. Rates above 10% indicate a systemic problem. Best-in-class practices maintain denial rates below 5%. In 2024, initial claim denials across healthcare reached 11.8% industry-wide. Behavioral health faces specific denial drivers that differ from other specialties — prior authorisation failures, concurrent review downgrades, medical necessity documentation gaps, and payer-specific modifier requirements. Eligibility issues alone account for approximately 22% of preventable denials.
Denial rate should be tracked weekly and segmented by root cause category. Treating all denials as a single aggregate number makes it impossible to distinguish between a coding problem, an eligibility failure, and an authorisation gap — three issues that require entirely different interventions.
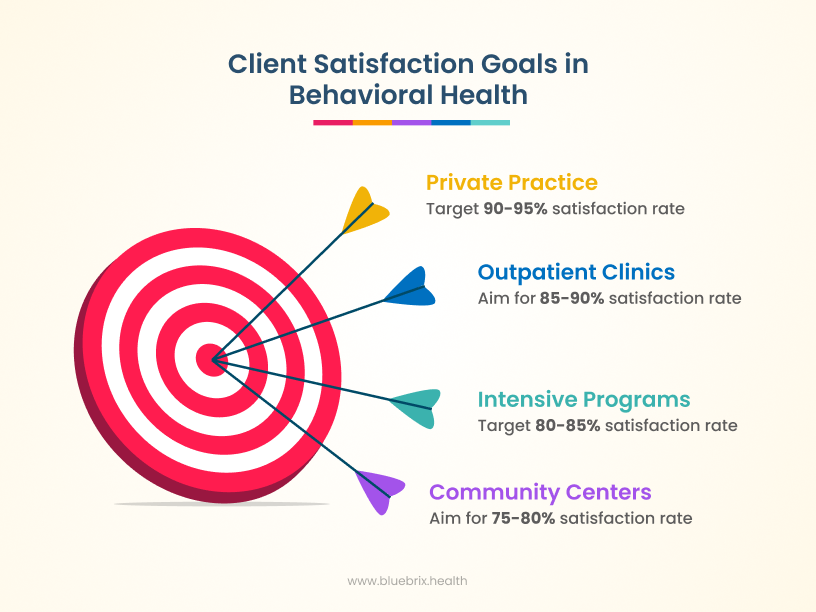
6. Client satisfaction and outcomes
This metric is a KPI that must be tracked by all those who are part of the value-based care model of treatment, as it determines their reimbursement. Tracking this information through methods such as collecting patient feedback through surveys, following up with patients, or keeping track of rehospitalization rates allows practices to consistently improve and meet requirements necessary to be compliant with the value-based care model.
Measuring client satisfaction and outcomes in behavioral health involves using a combination of subjective and objective tools to assess the quality of care and its impact on patients. Here’s a comprehensive overview of how these are measured:
Measuring client satisfaction
- Surveys and questionnaires:
- Tools like the Client Satisfaction Questionnaire (CSQ), Consumer Assessment of Healthcare Providers and Systems (CAHPS), Mental Health Surveys and the Service Satisfaction Scale (SSS) are commonly used to gauge satisfaction with services received.
- The Self-Help Agency Satisfaction Scale (SHASS) measures satisfaction with involvement in treatment decisions and services.
- Feedback sessions:
- Regular feedback sessions with clients help identify areas for improvement and assess overall satisfaction with care.
- Net promoter score (NPS) and patient satisfaction score (CSAT):
- These metrics measure client loyalty and satisfaction by asking how likely they are to recommend services to others.
Measuring outcomes
- Objective outcome measures:
- Symptom severity scales: Tools like the PHQ-9 for depression and GAD-7 for anxiety quantify symptom changes over time.
- Physiological indicators: These include measures of physical health that can be impacted by mental health treatments.
- Subjective outcome measures:
- Patient-reported outcome measures (PROMs): Clients report on their own symptoms and functioning, providing a personal perspective on treatment effectiveness.
- Self-report questionnaires: These capture changes in mood, coping mechanisms, and overall well-being.
- Clinician-rated measures:
- Observation-based assessments: Clinicians evaluate patient progress through observations and clinical interviews.
- Treatment-specific measures: Tools like the Cognitive Fusion Questionnaire (CFQ) for Acceptance and Commitment Therapy (ACT).
- Behavioral Health EHRs:
- blueBriX captures structured outcome data including PHQ-9, GAD-7, and programme-specific measures at the point of care and surfaces trend views across individual clients and patient populations. During implementation, clinics can configure dashboards to track the specific outcome measures required by their payer contracts or CCBHC quality reporting obligations.
Behavioral health treatment outcomes — what the data shows
Outcome measurement in behavioral health typically uses validated tools — primarily the PHQ-9 for depression and the GAD-7 for anxiety — administered at intake and at regular intervals throughout treatment. The following figures are drawn from a peer-reviewed retrospective cohort study of 2,984 adults who initiated mental health treatment in 2024, with outcomes measured using both instruments.
- Reliable symptom improvement rate: 65.8%
- Recovery rate: 53.2%
- Patients achieving either improvement or recovery: 71.3%
- Retention in care through the 12th session: 89.1%
These figures represent outcomes in a setting where clinicians were supported by a measurement-based care (MBC) platform and clinical decision support tools — meaning consistent outcome capture at the point of care was a structural part of the treatment model, not an afterthought. Clinics that do not systematically collect PHQ-9 and GAD-7 scores at every session cannot calculate any of these figures, which means they cannot demonstrate treatment effectiveness to payers, accreditation bodies, or their own clinical leadership.
Source: Luo et al., Depression and Anxiety Outcomes in a Technology-Enabled Psychotherapy Practice: Retrospective Cohort Study, JMIR Formative Research, December 2025. https://formative.jmir.org/2025/1/e76264
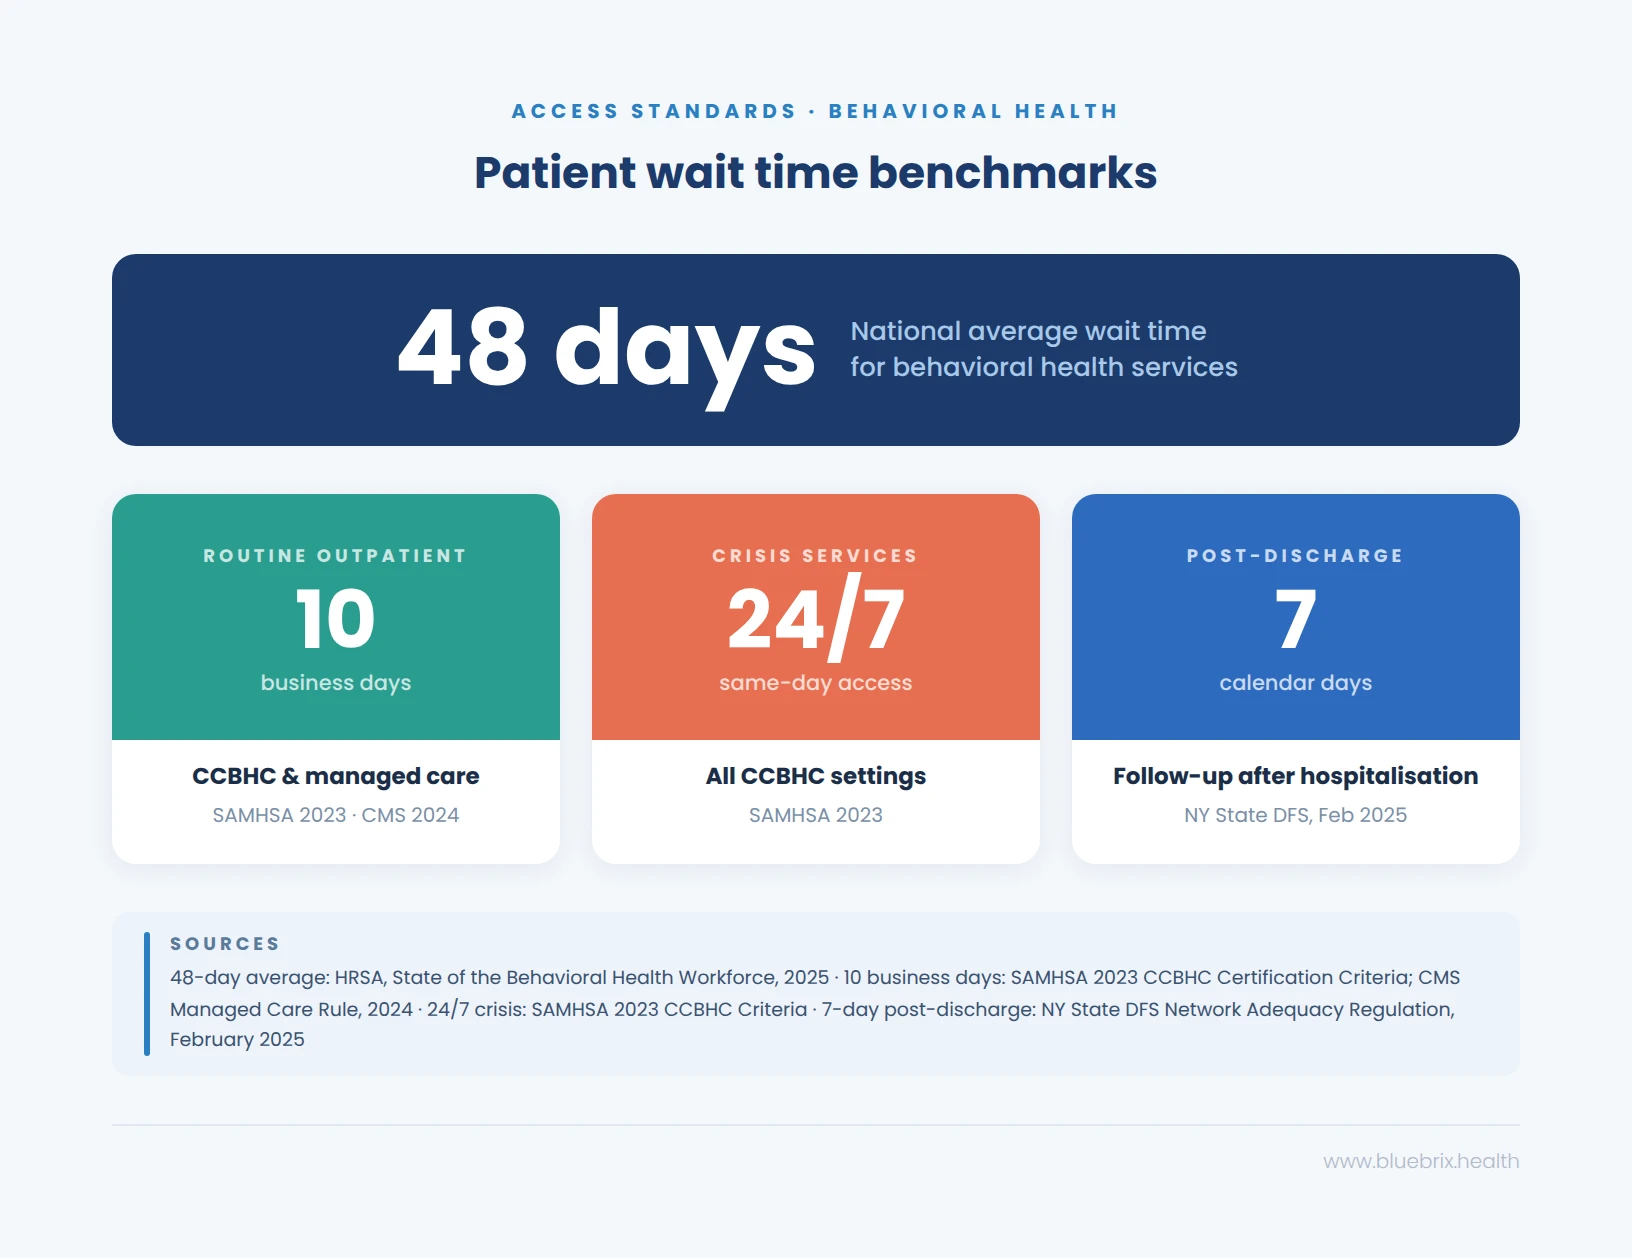
7. Patient wait time
This metric tracks the average patient wait time during an appointment before they are able to get face-to-face or one-on-one time with the provider. For example, if a patient arrives the clinic at 10:00 AM and is seen at 10:30 AM, the wait time is 30 minutes. This metric is helpful because long wait times are undesirable and might cause patients to no-show or cancel their appointment or seek treatment elsewhere. By reducing patient wait time, practices can improve patient satisfaction, reduce the probability of no-shows or cancellations, and improve efficiency and resource utilization.
8. Medication errors
Medication errors in behavioral health refer to mistakes in prescribing, dispensing, or administering medications. These errors can occur at any stage of the medication management process and can have serious consequences for patient safety and treatment outcomes. This metric provides important insight into medication administration and whether it is being done correctly. This metric is critical because it concerns patient safety. Ensuring that you have a medication management system that works correctly and that staff are knowledgeable and receive regular training can help prevent medication errors.
Medication Error Rate = (Number of Medication Errors / Total Number of Medications Administered) × 100
Research published in peer-reviewed literature on psychiatric inpatient settings found drug-related problems occurring at rates of approximately 152 per 1,000 patient days in settings without computerised physician order entry, reducing to approximately 81 per 1,000 patient days following implementation of clinical decision support systems. These figures reflect inpatient psychiatry settings and should not be extrapolated to outpatient contexts without setting-specific data.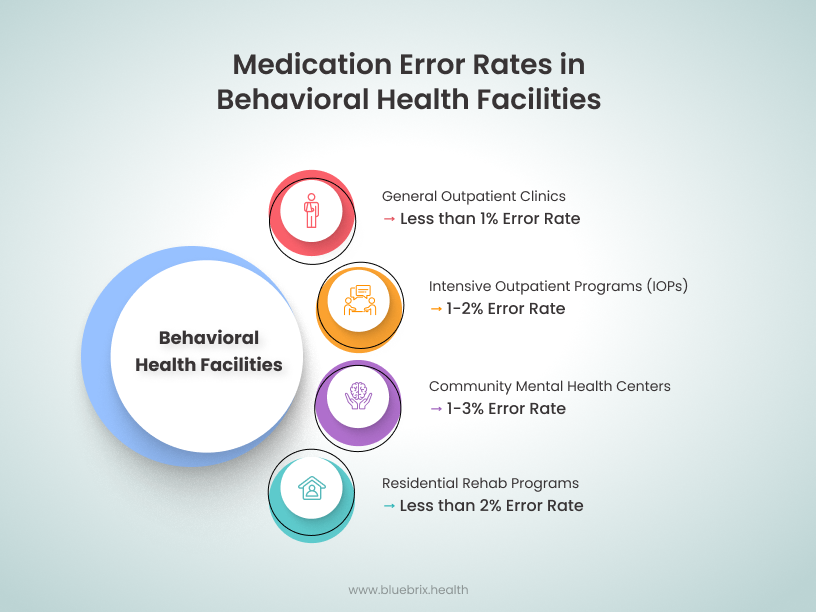
Source: WHO, ISMP
9. Average insurance claim processing time and cost
This metric provides an understanding of the time involved in filing claims and receiving reimbursements. Insurance Claim Processing Time refers to the duration it takes for an insurance claim to be processed from the time it is submitted until the payment is received. This is an important metric to track because the claims process can be impacted by many variables, such as proper coding, correctly entered information, and achieving pre-authorization. Understanding which variables can be improved upon and made more efficient and streamlined can significantly improve processing times while reducing the risk of denial or partial reimbursement.
Average processing time = total processing time for all claims / number of claims processed
Federal regulations under 42 CFR § 447.45 require state Medicaid agencies to pay 90% of all clean claims from practitioners within 30 days of receipt, and 99% within 90 days. As of January 2026, managed care plans must issue standard prior authorisation decisions within 7 days (reduced from 14 days under a 2024 CMS rule). For electronic claims, industry practice benchmarks processing at 7 to 14 days for private payers and 14 to 21 days for Medicare and Medicaid. Paper claims typically take 30 to 45 days.
Average claim processing time by payer type
| Payer type | Claim format | Average processing time | Federal standard |
|---|---|---|---|
| Medicare | Electronic | 14–30 days | 30 days (clean claim) |
| Medicaid | Electronic | Below 15% | 30 days (90% of clean claims) · 90 days (99%) |
| Private / commercial | Electronic | 14–21 days | Contractual — varies by payer |
| All payers | Paper | 30–45 days | No federal standard for paper |
Note: Timelines apply to clean claims only. Claims with errors, missing documentation, or prior authorization gaps fall outside these windows and are subject to denial or pended status.
10. Readmission rate
This metric tracks the percentage of patients who are readmitted to a behavioral healthcare facility within a specific period after being discharged. It is often used to assess the quality of care and the effectiveness of discharge planning. Lower readmission rates indicate effective treatment and follow-up care. This is particularly relevant for CCBHCs and SUD clinics, where ongoing care and relapse prevention are critical. While readmission rates are less commonly used for IOPs and outpatient clinics, these settings may track return visits or recurrence rates to monitor the need for additional care or adjustments in treatment plans.
Readmission Rate = (Number of readmitted patients within a specific period / Total number of discharged patients) x 100
Under the CMS Inpatient Psychiatric Facility Quality Reporting (IPFQR) programme, the 30-day all-cause readmission rate (READM-30-IPF) is a required publicly reported quality measure. Research using IPFQR data for 1,343 inpatient psychiatric facilities found a mean READM-30-IPF rate of 20%, with a range of 11% to 36%. Lower rates are consistently associated with stronger care coordination and discharge planning practices. For CCBHCs, the Plan All-Cause Readmissions Rate (PCR-AD) is one of the required state-collected quality measures under the SAMHSA CCBHC quality measure framework.
Readmission rate benchmarks
| Setting | Measure | National average / reported rate | Performance target |
|---|---|---|---|
| Inpatient psychiatric facilities (IPFs) | READM-30-IPF (CMS IPFQR) | Mean 20% across 1,343 facilities · range 11–36% | Below 15% |
| Inpatient psychiatric facilities (IPFs) | 30-day readmission (meta-analysis, 13 studies) | Pooled rate 16% (95% CI: 13–20%) | Below 15% |
| CCBHCs and Medicaid managed care plans | Plan All-Cause Readmissions Rate (PCR-AD) | O/E ratio benchmark: ≤1.0 (observed ≤ expected) | O/E ratio below 1.0 |
| All acute inpatient settings (HEDIS PCR) | Plan All-Cause Readmissions (PCR) | Reported as risk-adjusted O/E ratio · higher score = worse performance | Risk-adjusted O/E ratio below 1.0 |
Note: The 30-day window is standard across all measures. PRTF settings are not included in CMS IPFQR reporting — readmission tracking in residential settings follows state licensure requirements and CCBHC certification criteria where applicable.
See how blueBriX behavioral health EHR software works in practice. Book a demo.
If any of the benchmarks in this article are already flagging a gap in your clinic’s performance, that is the starting point for a blueBriX conversation. Book a consultation to walk through your current KPI reporting setup and where our behavioral health EHR can close the gap.
Book a demo